
- July 2026 local government education jobs report explained
- What the local government education employment decline actually measures
- How the next BLS employment situation report could confirm or weaken this trend
- Why this arrives amid staffing strain documented a couple of years ago
- How to check whether local education employment losses affect your district
- What to do next
July 2026 local government education jobs report explained
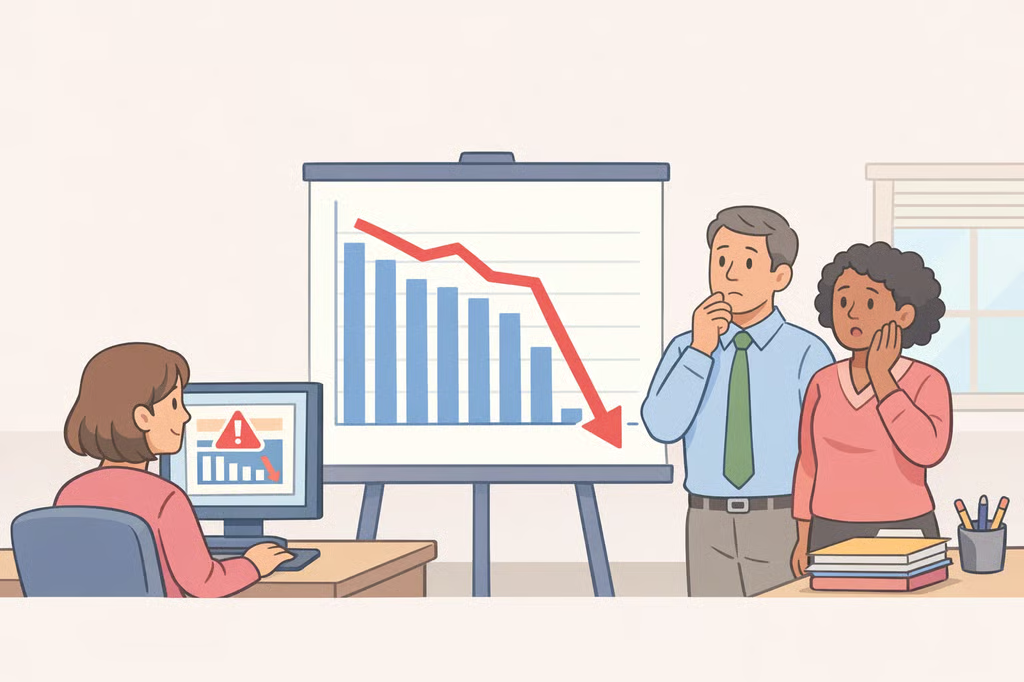
The July 2026 local government education jobs report, officially part of the Bureau of Labor Statistics' Employment Situation summary, showed local government education payrolls fell by 50,000 jobs last week, a steeper single-month drop than the entire nation's net change in total nonfarm employment, which fell by 23,000 (BLS). Both figures are net job changes in different categories, not cause and effect. The education decline was concentrated in one sector, while the national total reflects gains and losses across the whole economy. Read side by side, though, the education number still stands out, and it raises a more useful question than "how bad is this?" What does a 50,000-job drop in one broad industry category actually tell a parent, teacher, or district employee about their own school?
The decline was larger than any other individual industry change highlighted in the same release. Retail trade lost 19,000 jobs, financial activities fell by 14,000, and health care kept adding positions, up 22,000 for the month (BLS data). The national unemployment rate barely moved, holding at 4.1% (BLS), and local government education itself had shown little net change over the prior 12 months before this single-month drop (BLS). A nearly unchanged national payroll total and unemployment rate sitting next to one sharp sector-specific move is exactly the kind of number that gets stripped of context once it hits a headline.
That matters most to three kinds of readers: parents wondering whether their child's school lost staff, school employees wondering whether their own position is at risk, and community members trying to make sense of a statistic before the next budget or board meeting. None of those questions get answered by the national number alone. What follows is a look at what the BLS figure actually measures, what it leaves out, and which documents and questions will tell you whether it applies to your district.
What the local government education employment decline actually measures
The 50,000 figure comes from the Current Employment Statistics survey, the same monthly payroll survey behind every headline jobs number. It draws from roughly 119,000 businesses and government agencies covering about 622,000 individual worksites, and it counts people reported on payroll during the pay period that includes the 12th of the month (BLS). Industries, including local government education, get sorted using the North American Industry Classification System (BLS).
That means the number is a payroll snapshot, not a layoff count. It reflects how many people were reported on employer payrolls during that reference pay period, and it does not say why the count changed from one month to the next (BLS). Outside the release itself, possible explanations could include layoffs, vacancies left unfilled after people quit or retired, delayed hiring ahead of the new school year, or a shift in when districts report staff onto payroll. None of these is confirmed by the data. The release simply doesn't say which, if any, occurred in July.
The national summary also doesn't break the 50,000-job figure into occupations, states, districts, or metro areas (BLS). That's a real gap for anyone trying to localize the story. There's no way from this release alone to tell whether teachers, bus drivers, cafeteria staff, or administrative roles accounted for the drop, or whether it was concentrated in a few states rather than spread nationwide.
BLS revises payroll estimates as more data comes in. May and June 2026 payroll estimates were revised down by a combined 103,000 jobs after they were first reported (BLS). That revision applied to total nonfarm payrolls, not specifically to local government education, but it shows how much a first-reported month can move. The July local government education figure could shift the same way once BLS revises it alongside next month's data.
How the next BLS employment situation report could confirm or weaken this trend
The next Employment Situation report, covering August 2026, is scheduled for release on September 4, 2026 (BLS). Given the revision pattern already visible in this release, that report will likely carry an updated estimate for July alongside its first look at August. One month of data can't establish a trend on its own. A second consecutive decline, confirmed after revision, would be a meaningfully different signal than a single drop followed by a rebound.
Readers trying to track whether July was a one-month blip or the start of something longer can watch for a few specific things:
- Whether the August report shows local government education continuing to decline, or shows July as an outlier
- Whether state or district budget documents for the 2026-27 school year, once published, show position eliminations, hiring freezes, or unfilled vacancies
- Whether any confirmed reductions get tied publicly to expiring federal relief funds, enrollment declines, or general fund shortfalls, or whether the cause stays unclear
One backdrop worth watching, though not something the July data confirms on its own, is the wind-down of federal pandemic relief money for schools. The American Rescue Plan's Elementary and Secondary School Emergency Relief Fund was the largest of the three ESSER rounds, providing $122 billion, compared with $13.2 billion set aside under the CARES Act and $54.3 billion under the CRRSA Act (U.S. Department of Education). Roughly two-thirds of that ARP ESSER money, about $81.3 billion, went out to states within two weeks of the law's signing in March 2021, and all of it had been distributed by the end of that year, once every state's spending plan was approved (U.S. Department of Education). Some districts may have used that money for staffing, though this article does not establish how widely that occurred. Whether the tail end of that spending contributed to July's decline is an open question. A concrete way to test it in your own district: ask whether any affected position traces back to ARP ESSER or another pandemic relief grant, and if so, what funding, if any, replaces it now.
Why this arrives amid staffing strain documented a couple of years ago
The national figure also lands on a system that flagged staffing pressure in earlier surveys. Two years ago, before the 2024-25 school year began, 67% of public schools expected to fill multiple teaching vacancies, up from 56% two years before that, and 59% expected multiple non-teaching vacancies, up from 45% (NCES School Pulse Panel). That's a snapshot from two school years ago, not a description of conditions today, but it shows a system already under pressure before this year's payroll numbers came out.
The same NCES survey found that only 48% of public schools said they could effectively provide mental health services to every student who needed them during the 2023-24 school year, down from 56% two years before, with insufficient staff coverage cited as the most common barrier, reported by 55% of schools (NCES). If July's losses eventually turn out to touch counselors, school psychologists, or other student-support staff, they would land on a system that already reported thin coverage in this area. That's a reason to ask your own district specifically about those positions, not proof they were the ones affected this time.
None of these figures describe July 2026. They describe the 2023-24 school year, and current, 2025-26 vacancy or staffing data would be needed to say whether the same strain still holds. Treat them as a reason the topic deserves a closer look locally, not as evidence of what happened this summer.
How to check whether local education employment losses affect your district
Local budget and staffing records are the best place to verify whether the national signal shows up in your district. Their definitions and dates need comparing carefully, since districts don't all track the same numbers the same way. Three groups of readers will want different information, and each has a specific place to start.
- Parents: Ask the school or district whether any student-facing positions or services changed for the 2026-27 school year, including class sizes, counselor or nurse availability, special-education staffing, or bus routes. Start with the school office, the district's HR or finance office, or a public board meeting comment period. Ask specifically how current staffing compares to last year, not just whether "cuts" happened.
- School employees: Check whether your position appears in the district's adopted or proposed 2026-27 budget, depending on where your district is in its budget calendar, along with its staffing or position-allocation report. Ask HR directly whether your role is funded through a federal relief grant such as ESSER, and if so, what happens to that position once the grant money runs out.
- Community members and taxpayers: Look at recent school board agendas and meeting minutes for budget or staffing discussions. Ask the board or superintendent's office to separate layoffs from attrition, meaning unfilled vacancies after people leave, and from planned reductions, since these carry different implications for the budget and often get recorded differently.
Once a document is in hand, a few distinctions help avoid misreading it, though districts label these categories differently and it's worth confirming terms with the finance or HR office directly:
- Authorized versus filled positions. A budget line can show authorized positions, meaning funded slots the district is permitted to fill, or filled positions, meaning slots with a person currently in them. The gap between the two is where unfilled vacancies live.
- Full-time-equivalent positions versus individual employees. Staffing tables sometimes count FTE, which combines part-time roles into fractional units, rather than a headcount of actual people. A drop in FTE doesn't always mean the same number of people lost jobs.
- Budgeted versus actual staffing. A budget shows what a district planned to spend and staff; actual reports show who is currently employed. Districts sometimes budget for roles they haven't yet hired for, so a budgeted position isn't necessarily a filled one.
- Attrition versus a formal reduction. Attrition happens when someone leaves and the district doesn't refill the role. A formal elimination of a position is a different, more deliberate action. Either can shrink headcount without leaving the same kind of paper trail, so ask the district which applies to any specific position you're tracking.
- Funding source. Checking whether a position is paid from the general fund, state aid, or a federal grant can help identify whether it depends on money with an end date. How much risk that creates varies by district and state, and is worth asking about directly rather than assuming.
A practical place to start: ask your district for its adopted or proposed 2026-27 budget, the staffing or position-allocation report, board meeting minutes from budget-adoption season, any public reduction-in-force notices if they exist, and current vacancy postings on the district's HR page. Not every district publishes all of these online, and some publish FTE tables rather than headcounts. If you can't find one, ask the finance or HR office whether it exists and how to request it.
What to do next
A national payroll estimate can't tell you whether your child's school lost a counselor, whether your own position is safe, or whether your district's budget is actually shrinking. Local records, read carefully, come closer. Before assuming the July number describes your school, ask your district's finance or HR office three specific questions:
- How many positions were budgeted and how many were filled this year compared with last year?
- Which positions, if any, are currently vacant, eliminated, or funded by a grant such as ESSER?
- Does the district attribute any staffing change to enrollment shifts, general fund shortfalls, or the end of ESSER support?
Write down the answers alongside the date of the report or budget document they came from. That paper trail, not the national figure alone, is what will tell you what's actually happening in your child's classroom, your job, or your community's schools.