
- University of California Calculus I failure rate: UC DFWNP
- What the UC introductory math DFWNP rate measures
- How the UC introductory math DFW rate compares with other courses
- What UC San Diego’s placement data may explain
- Why high school course titles do not settle readiness
- Capacity and equity are part of the question
- What students should check before enrolling
University of California Calculus I failure rate: UC DFWNP
The University of California Calculus I failure rate is not one official number for every Calculus I class. The University of California’s systemwide data combine Calculus I, precalculus, and preparatory mathematics, then count grades of D or F, withdrawals, and no-pass results together. In 2025–26, 17.8% of enrollments in that combined category ended in one of those outcomes, according to a UC Regents report released last month.
That figure is serious, but it needs careful reading. It does not mean that 17.8% of UC students failed Calculus I. It is a DFWNP rate, and it covers several kinds of courses and outcomes. The available data also do not predict what will happen to one student at one UC campus.
For students and families planning a UC math pathway, the useful question is more practical: What does the systemwide trend show, what may help explain it, and what should a student verify before enrolling in Calculus I or a related course?
What the UC introductory math DFWNP rate measures

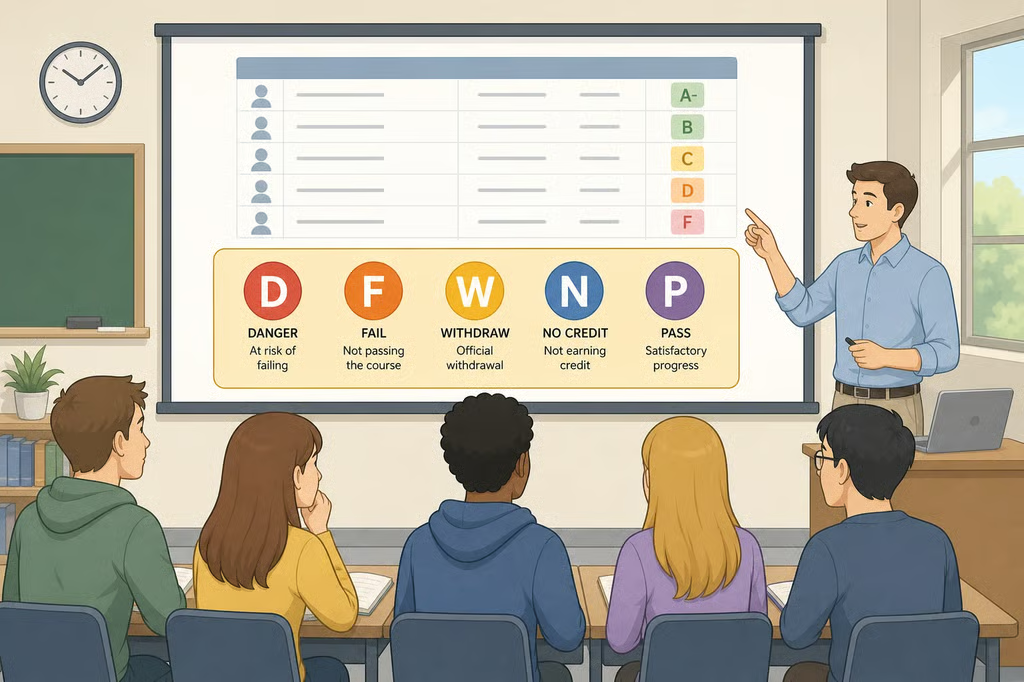
DFWNP combines four outcomes:
- D grades
- F grades
- Withdrawals
- No-pass marks
A D or F reflects a course grade, while a withdrawal means the student left the course under the campus’s withdrawal rules. A no-pass mark may apply in a pass/no-pass grading system. Those outcomes can have different causes and consequences, so treating all of them as “failure” oversimplifies the data.
The systemwide series gives two useful comparisons. Looking across the full table, the combined Calculus I, precalculus, and preparatory-math DFWNP rate rose from 9.2% in 2020–21 to 17.8% in 2025–26. Looking at the five-year comparison highlighted in the report, the rate increased from 13.0% in 2021–22 to 17.8% in 2025–26. The two comparisons are not contradictory. One begins with the 2020–21 academic year; the other begins with 2021–22. UC Regents data show both points in the series.
Average grades moved in the same direction. The average GPA for these math courses fell from 2.95 to 2.71 over the five-year comparison period, while the DFWNP rate rose from 13% to 18%. The UC Regents report identifies mathematics as the main exception to otherwise relatively stable lower-division grades.
That still is not a standalone Calculus I failure figure. The category includes precalculus and preparatory courses, and the systemwide report does not present the result as a rate for every individual campus or section. The figure, as presented, also cannot tell a reader how many students later repeated a course and passed. For a student deciding whether to take a particular class, the campus’s placement rules and course policies matter more than the systemwide average alone.
There is another reason to avoid reading the number as a prediction. The math courses make up about 5% of lower-division enrollment, according to UC Regents data. The higher DFWNP rate is concentrated in a relatively small part of the lower-division curriculum rather than spread evenly across all introductory courses.
How the UC introductory math DFW rate compares with other courses

The contrast with other lower-division courses is substantial. For incoming freshmen, the overall lower-division GPA has stayed near 3.32, and the overall DFWNP rate has remained around 7%. In the combined Calculus I, precalculus, and preparatory-math category, the rate reached 17.8%. The UC Regents report supports both comparisons.
The GPA pattern also differs by discipline. Lower-division GPA has remained relatively flat at about 3.2 for other STEM courses, 3.4 for Engineering and Computer Science and Social Sciences, 3.5 for Arts and Humanities, and 3.6 for interdisciplinary courses. UC Regents data show no comparable decline across those categories.
That comparison supports a narrower interpretation: introductory math is showing a distinct problem within a broader system that has not experienced the same pattern across most lower-division fields. It does not establish why the difference exists. Math courses may depend on a sequence of skills that students need to use immediately, while other courses may measure different kinds of preparation. The supplied data show the outcome gap, not a complete explanation for it.
Retention provides useful context, but it measures something different from course performance. A student can struggle in a math course and remain enrolled, just as a student can leave for reasons unrelated to math. A UCOP report published two years ago describes first-year retention for the freshman class entering in 2022 as up one percentage point overall and by more than two percentage points for Black, Latinx, and Native American students. Transfer retention exceeded 93% for all students, including low-income, first-generation, and underrepresented students, for the first time since the pandemic. UCOP’s report provides that context.
Those retention figures do not prove that the math trend is harmless, and they do not measure whether students passed Calculus I. They do make one broad claim harder to support: that the DFWNP increase is evidence of academic decline across the entire UC system. The evidence points instead to a concentrated challenge that may still affect degree progress, especially for students whose majors require several quantitative courses.
What UC San Diego’s placement data may explain

UC San Diego offers a concrete case study, not a substitute for systemwide evidence. Its course numbers and placement categories should not be treated as a universal UC sequence. Still, the campus report helps show how preparation, placement, and course progression can interact.
At UC San Diego, the combined number of students placed into Math 2 and 3B grew from 191 in 2021–22 to 921 in 2025–26, an increase of 730 students. The report describes these as students needing remediation before entering the earliest college-level math courses, Math 3C or 4C. In Fall 2024, the combined group exceeded 900 students and represented 12.5% of the incoming first-year class. In Fall 2025, the number increased again, while the group represented 11.8% of the larger incoming class. A UC San Diego report released earlier this year reports these figures separately.
The distinction between number and percentage matters. A group can grow in raw size while represent a slightly smaller share of a larger entering class. That is why the Fall 2024 figure of 12.5% and the Fall 2025 figure of 11.8% should not be blended into one trend line. They describe different incoming classes.
The report also connects the lowest placement category with later DFW outcomes. Based on data from 2017 through 2023, students with the specified placement had DFW rates of 24.1% in Math 10A, 30.3% in Math 10B, and 40.7% in Math 10C. Students placed into 3C had lower rates in those same courses, at 15.2%, 19.5%, and 25.1%, respectively. These are DFW rates, not DFWNP rates, because the UC San Diego figures count D grades, F grades, and withdrawals but exclude no-pass marks. The UC San Diego report identifies the 2017–2023 period.
The difference becomes larger in the Math 20 series for students with Math 2 placement. The DFW rate was 31.2% in Math 20B and 51.8% in Math 20C. Those results should not be presented as current rates for every student or every UC campus. They describe a particular UC San Diego placement group and historical course data, but they show why a placement result deserves attention before a student begins a demanding sequence.
The course sequence also matters for planning. UC San Diego’s report notes that Math 10B is the final calculus course required for the Psychology Bachelor of Science and most Biology majors. A student who needs that course may face a different planning problem from a student whose major requires a longer Math 20 pathway. The course numbers are campus-specific, so students should confirm the equivalent course and prerequisite sequence for their own major.
Why high school course titles do not settle readiness
One possible explanation for higher DFW rates is that students arrive without enough preparation. UC San Diego’s data complicate that explanation. Among students in Fall 2024 whose demonstrated math skills did not meet middle-school levels, only 6% had completed no more than the minimum high school math requirement. The other 94% had gone beyond that minimum, including 42% who had completed calculus or precalculus. The UC San Diego report gives those figures.
This does not mean high school math courses have no value. It means a transcript title such as “precalculus” or “calculus” may not reveal whether a student can retrieve and apply the specific skills expected in a college course. Course content, timing, grading practices, access to advanced classes, and the placement method may all affect what the transcript communicates. The supplied evidence does not measure each of those factors, so it cannot identify one cause.
UCOP describes a related possibility in broader terms: a gateway course may assume foundational concepts that a student has not previously learned. Its report also points to wide variation in students’ prior math experiences and to socioeconomic status as one factor associated with that experience. UCOP’s analysis presents this as a common concern in introductory mathematics, not as proof that one factor caused the UC-wide increase.
That distinction matters for students. A placement result is information about the next course to examine, not a judgment about intelligence or effort. It may indicate that a student needs a review course, a different starting point, or more support before taking a required calculus class.
Capacity and equity are part of the question
Placement is only useful if students can access an appropriate next course. At UC San Diego, the Mathematics Department could serve 480 students from the larger group that needed a course to remediate math knowledge before entering Math 3C or 4C. The UC San Diego report documents that capacity mismatch.
The figure does not prove that limited remediation capacity caused the systemwide DFWNP increase, or even that it caused every UC San Diego outcome. It does show a practical pressure point. If more students need an on-ramp course than the department can serve, students and advisers may have to plan around course availability, prerequisites, or delays in entering college-level math.
The placement increase also affected LCFF+ students disproportionately at UC San Diego. The report says that one in eight LCFF+ students required Math 2 or 3B placement in 2021–22; by 2025–26, the figure had risen to one in three. The report uses “LCFF+” as its own student classification, so readers should not assume that it is interchangeable with every campus’s definition of low-income status. UC San Diego data show the change.
UC campuses are also testing broader approaches to introductory STEM education. UC Davis, UC Irvine, and UC Santa Barbara are members of the Sloan Foundation-funded SEISMIC Collaboration, which focuses on equity and inclusion in introductory STEM courses. A UCOP report identifies that participation, but the available research here does not establish that it has improved math pass rates.
The evidence therefore supports a cautious conclusion. The rising DFWNP rate may reflect preparation gaps, differences in prior opportunity, course sequencing, placement patterns, capacity limits, or several factors at once. The current data document the pattern more clearly than they establish its cause.
What students should check before enrolling

A systemwide rate cannot determine an individual outcome. A student who places into Calculus I may pass comfortably, while another student with the same placement may need additional review. The best next step is to replace a broad question about the UC failure rate with specific questions about the campus and major.
Before enrolling, ask the relevant math department or advising office:
- How is placement determined, and can students request a diagnostic review?
- Which course is equivalent to Calculus I for the intended major?
- What prerequisites apply, and are they enforced before enrollment?
- Does the campus offer a bridge, co-requisite, review, or lower-intensity on-ramp course?
- Is tutoring available, and when can students use it?
- How many math courses does the intended major require?
- Which course sequence is recommended for students placed below college-level math?
- Could course availability change the expected timeline for completing the math requirement?
Incoming students should compare the placement result with the major’s actual requirements rather than enrolling based only on a high school course title. Current students can ask whether a lower-intensity option or placement review is available before attempting a course that may not match their preparation.
Families, counselors, and tutors can help by treating the transcript as one piece of information, not a guarantee of college-level readiness. Placement systems, course equivalencies, prerequisite rules, tutoring programs, and remediation capacity vary by campus. The University of California’s combined 17.8% DFWNP figure shows a real systemwide concern, but the decision that matters next is local: verify the course sequence, understand the placement result, and identify available support before registration.