
- Decline of U.S. Universities: What the Data Really Show
- Two different numbers, one confused headline
- Where the decline of U.S. universities argument holds up
- Research money is concentrated, but not more than it used to be
- What's known about international scientists leaving the United States
- Before you commit: questions no national statistic can answer
- The decision rule
Decline of U.S. Universities: What the Data Really Show
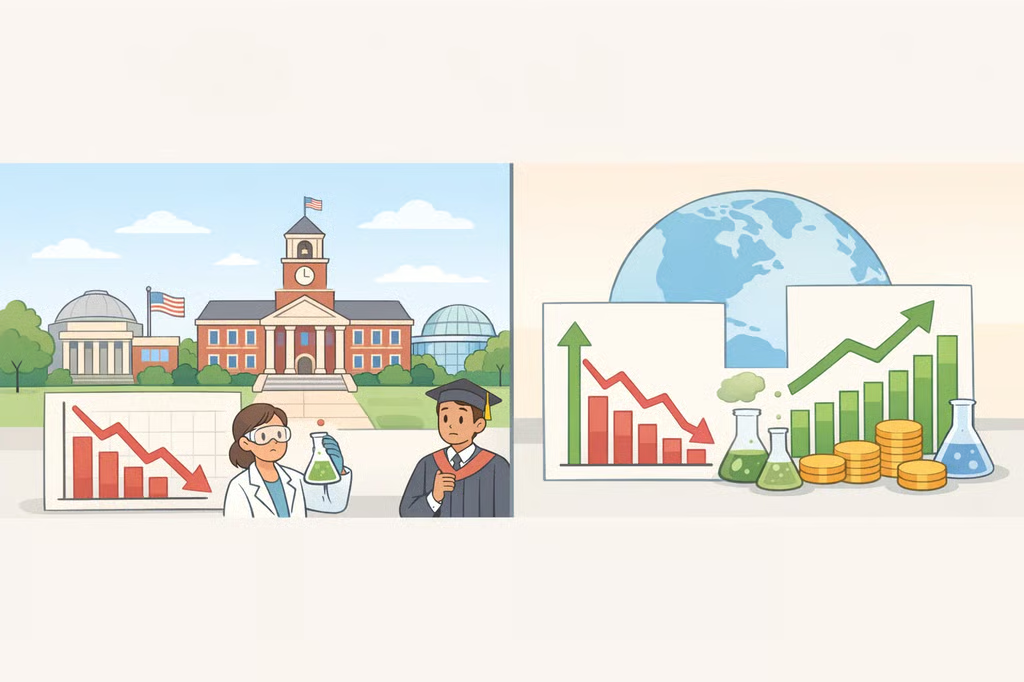
Ask around and you'll hear two contradictory stories about the decline of U.S. universities. One says American research funding is collapsing. The other says U.S. university research spending just posted its biggest jump in two decades. Both stories point to real numbers. They just aren't measuring the same thing, and treating them as interchangeable is how a misleading narrative about U.S. higher education decline takes hold.
If you're a prospective graduate student, postdoc, or early-career researcher deciding whether to build a career inside the U.S. system, that distinction matters more than any headline. This article separates the two measures, shows where U.S. university research has genuinely lost ground and where it hasn't, and lays out what to verify at the program level before you sign a multi-year commitment. One limitation applies to everything below: the most recent complete academic-spending data run through fiscal year 2023, so none of these figures can tell you what's happened to funding conditions in the two years since. Keep that gap in mind, because a "here's what the data show" article is not the same as a "here's what's happening right now" article.
Two different numbers, one confused headline
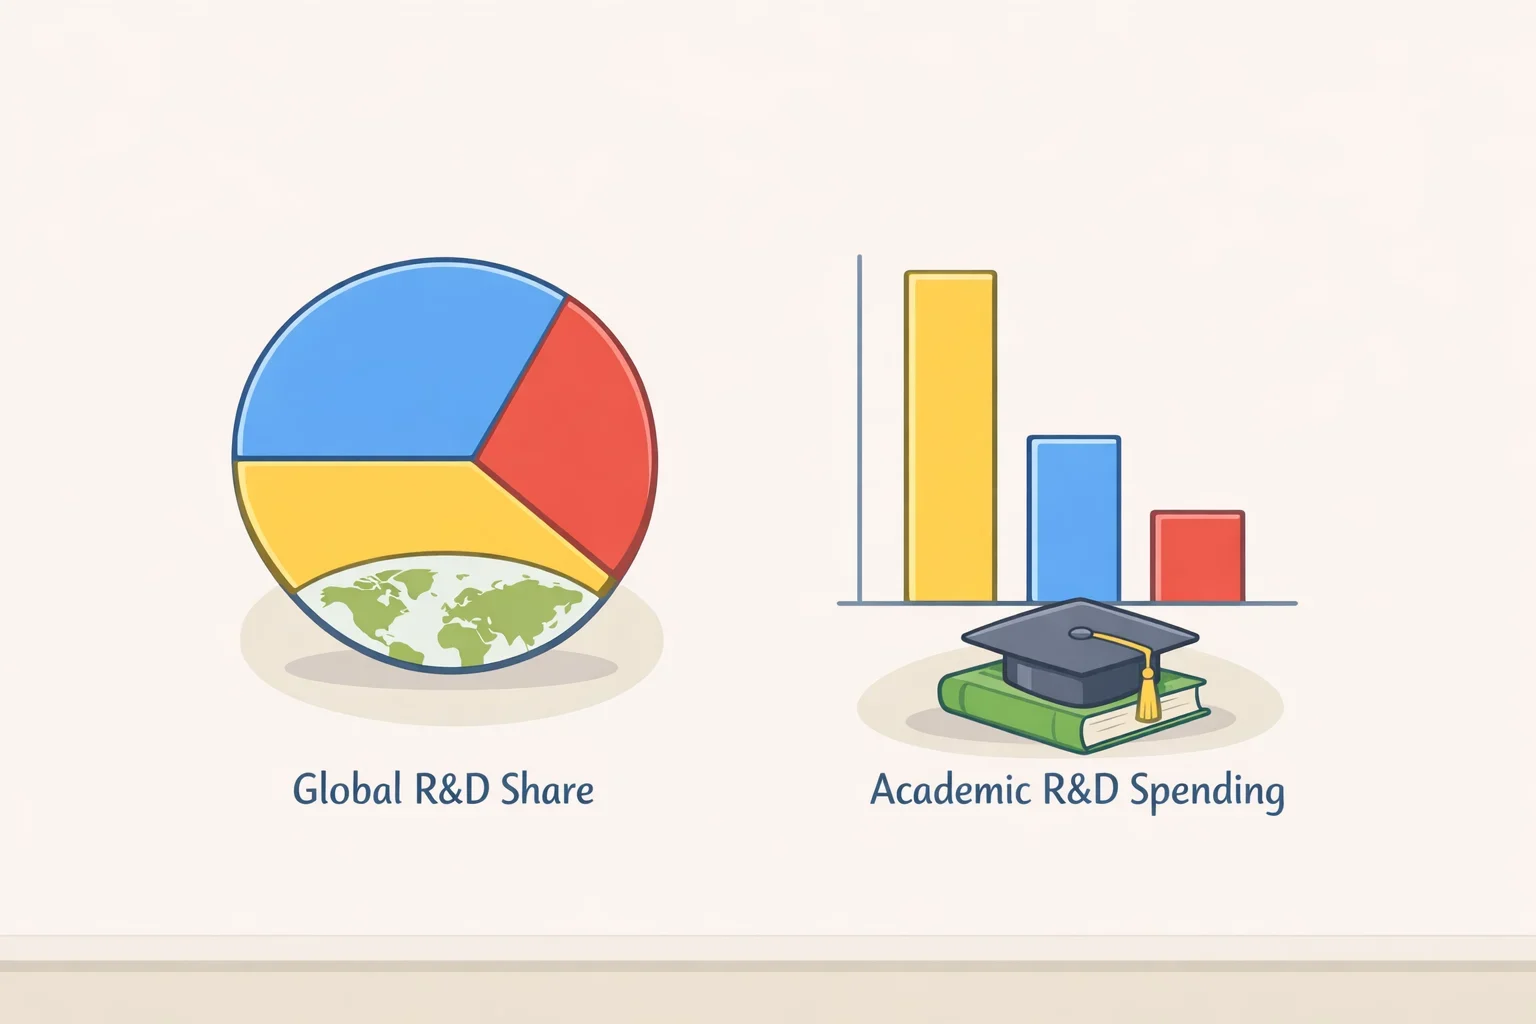
The figure that shows up in most "American research is falling behind" stories is the U.S. share of global R&D spending, a category that includes corporate labs, government agencies, and universities combined. That share fell from 39% in 2000 to 30% in 2022, after dropping to 31% back in 2010 and holding roughly flat since (NSF NCSES, reported 13 months ago).
That's an economy-wide statistic. It says nothing on its own about how much money universities specifically are spending on research. The number that answers that question is academic R&D spending, and it tells a different story: $108.8 billion in FY 2023, an 11.2% increase in current dollars over the prior year and the largest jump since FY 2003 (NSF NCSES, reported 21 months ago). For most institutions, that fiscal year ran from July 1, 2022, through June 30, 2023, so this is a backward-looking snapshot of a period that ended more than three years ago, not a live read on this year.
These figures can be confused because both get labeled "R&D" in public conversation, even though one measures the United States against a fast-growing world economy and the other measures universities against their own recent history. A shrinking global share of total R&D activity and a growing pool of university research dollars can both be true at once. Everything from here forward in this article uses the academic-specific data, since that's what actually describes the system a graduate student or faculty candidate is entering. If you want a shorthand for the difference: a "U.S. university research funding crisis" and a "declining U.S. global R&D share" are two separate claims, and only one of them is actually about universities.
Where the decline of U.S. universities argument holds up
If there's a defensible version of "U.S. universities are falling behind," it isn't in the dollar totals. It's in R&D intensity, which measures research spending as a share of a country's overall economic size rather than as a raw dollar figure.
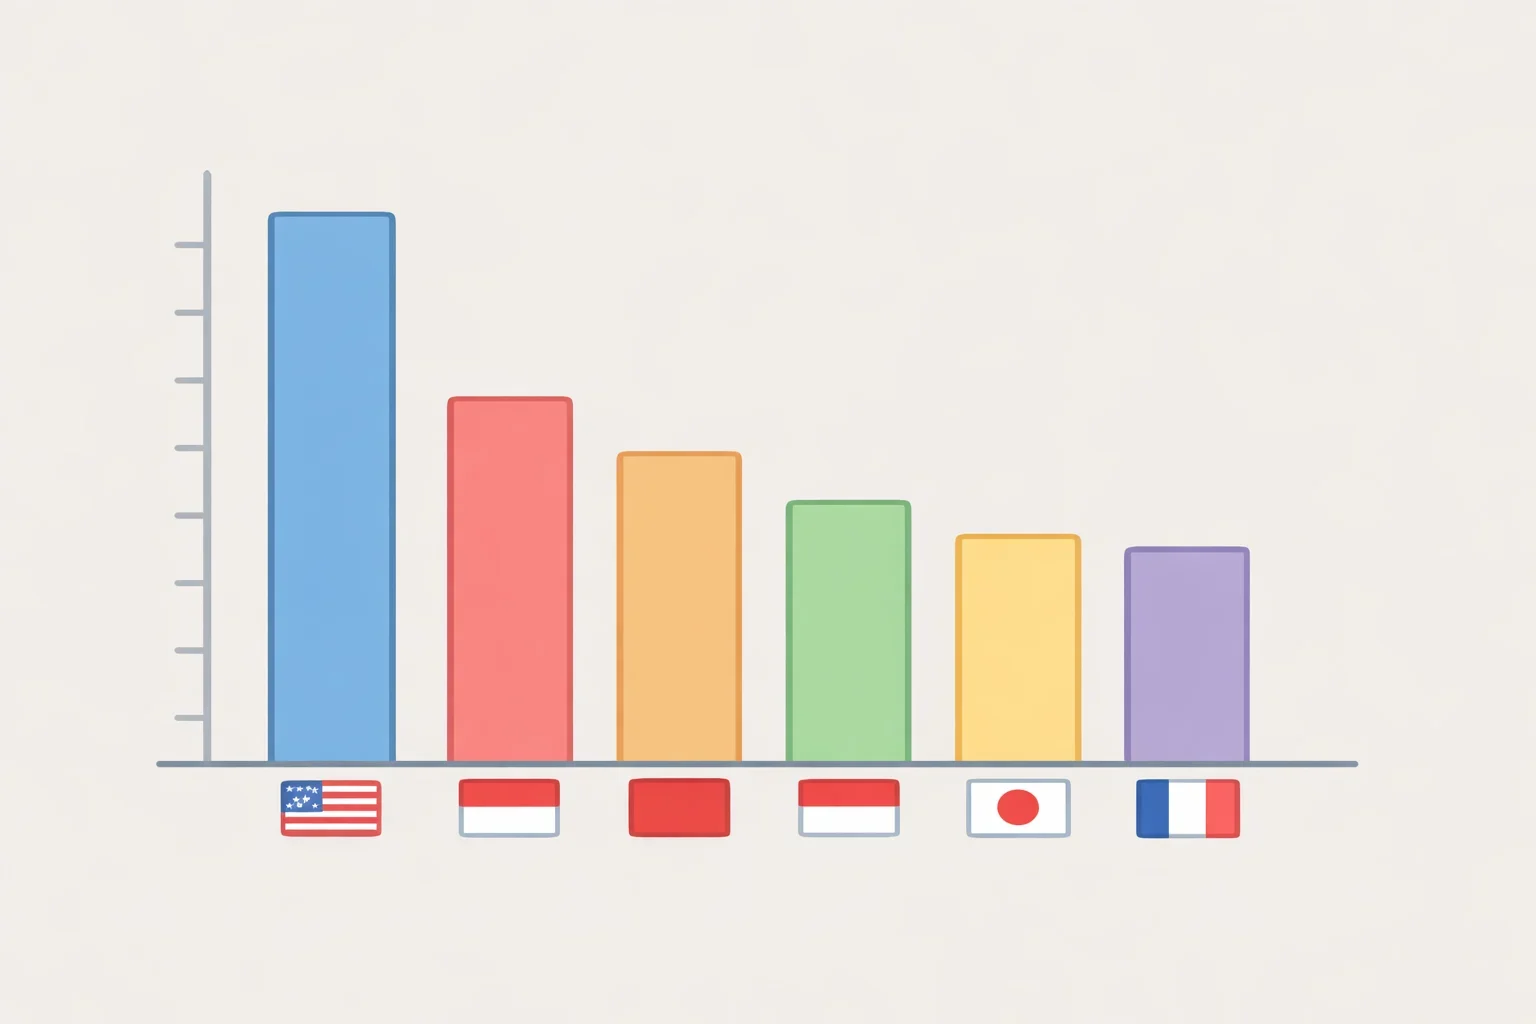
At the economy-wide level, the United States spent $806.0 billion on all R&D in 2021 in current U.S. purchasing-power-parity dollars, more than any other country, including China's $667.6 billion. But China's spending grew faster that year, 14% compared with 10% for the United States, and U.S. R&D intensity came in at 3.46% of GDP, behind South Korea's 4.93% and Israel, the only two countries above 4% (NSF NCSES, reported 27 months ago).
Narrow that down to academic R&D specifically, the figure that actually applies to a university lab, and the pattern gets sharper. U.S. academic R&D intensity has sat between 0.36% and 0.38% of GDP every year since 2012, ranking 23rd among 32 reporting nations in 2021. Germany's academic R&D intensity, by contrast, rose from 0.51% to 0.57% over that same stretch (NSF NCSES, reported 34 months ago).
The United States still outspends everyone else in absolute academic R&D dollars, $81 billion in 2020 compared with $28 billion for Germany and $20 billion each for the United Kingdom and Japan (NSF NCSES, reported 34 months ago). So the honest read isn't that American universities are spending less. It's that the national commitment hasn't grown relative to the size of the economy while some peer countries kept pushing theirs up, and that gap is the strongest evidence for anyone asking why U.S. universities are declining relative to their competitors, even if the dollar figures keep climbing.
Two caveats matter here. These cross-national comparisons only run through 2021, and newer figures weren't part of the research reviewed for this article, so treat 2021 as the most current available comparison point rather than an up-to-date one. China's 2019 through 2021 R&D data were also placed under formal OECD review, as noted in the 2023 NCSES publication cited above, so any U.S.-China comparison should be read as directional rather than precise (NSF NCSES, reported 34 months ago).
If you're weighing a U.S. graduate program against one abroad, this is the number worth asking about: the recent trend in a country's academic R&D intensity, not just which country currently spends the most total dollars.
Research money is concentrated, but not more than it used to be
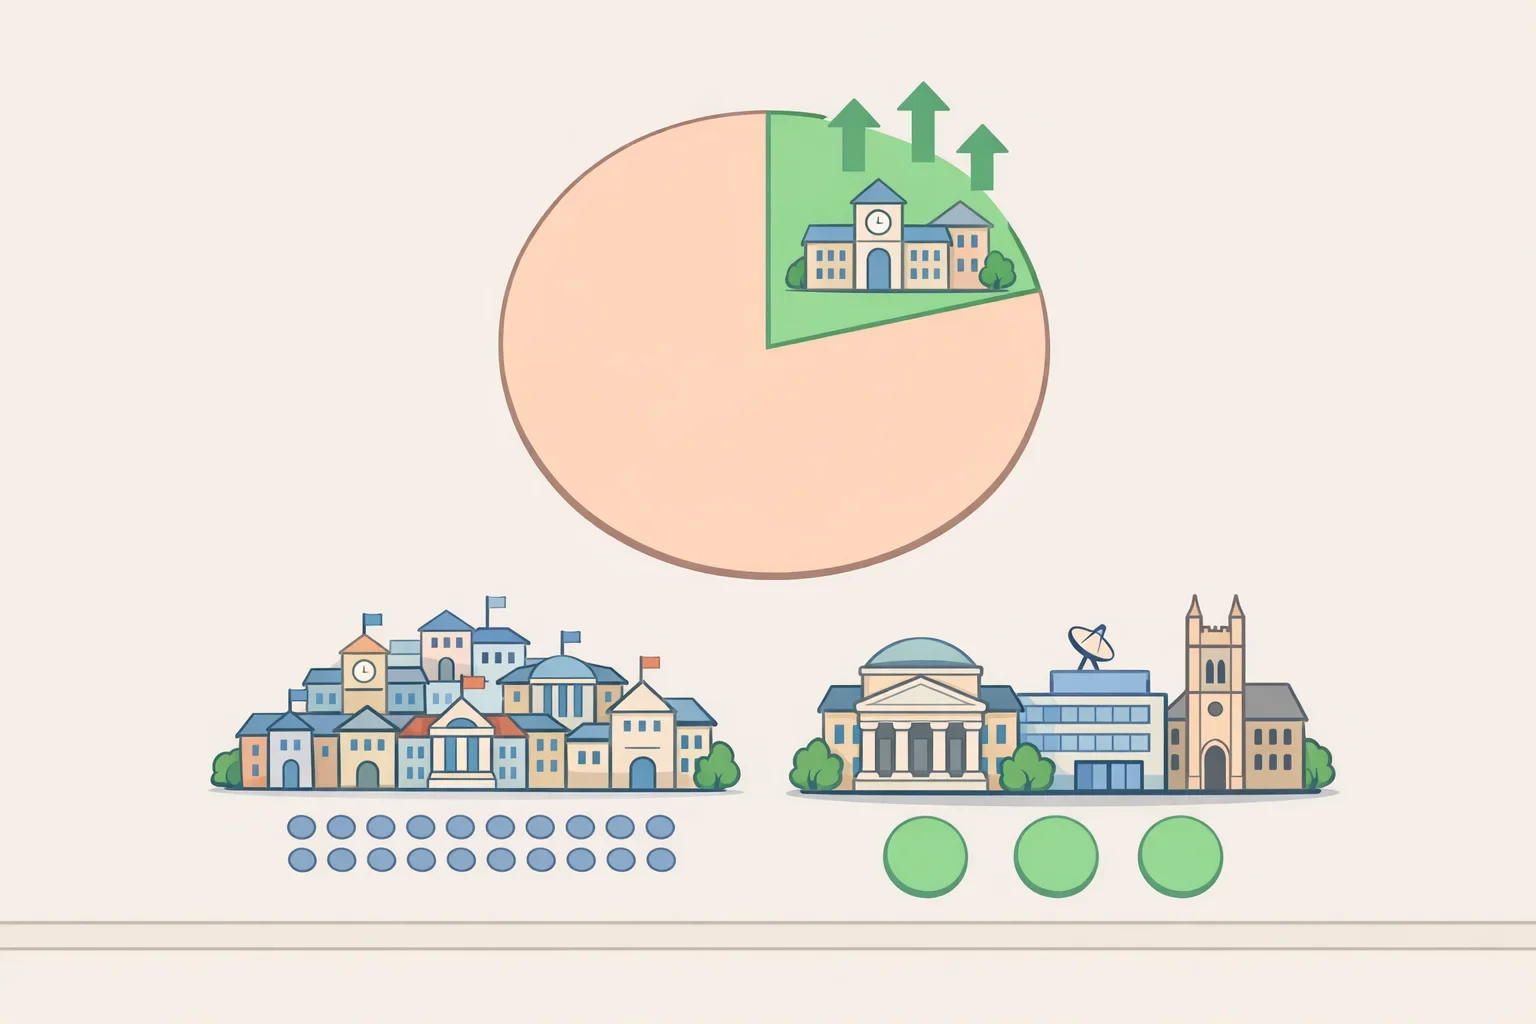
A separate piece of the decline narrative claims that U.S. research funding is pooling into an ever-smaller set of elite institutions, leaving everyone else behind. The FY 2023 data don't support the "ever-smaller" part.
The top 30 research institutions accounted for 42% of all higher-education R&D spending in FY 2023, a share consistent with prior years rather than a new high (NSF NCSES, reported 21 months ago). Meanwhile, the number of institutions spending at least $1 billion on R&D rose from 24 in FY 2021 to 33 in FY 2023 (NSF NCSES, reported 21 months ago). That doesn't prove the range of institutions doing serious research grew, since inflation and rising costs push more schools past any fixed dollar line over time, but it does undercut the claim that the top tier is pulling further away from everyone else.
What the data do show clearly is concentration by field. Twenty-eight of the top 30 institutions have medical schools, and health sciences plus biological and biomedical sciences together account for 51% of all university R&D spending (NSF NCSES, reported 21 months ago). Research capacity, in other words, tracks which fields a school can support at scale, particularly biomedical fields with major federal funding streams, not just general prestige.
The practical implication: "U.S. universities" isn't one system moving in one direction. A program's research strength depends heavily on its field and its funding base, which is exactly why national totals and institutional rankings can mislead an applicant looking at one specific department. Before assuming a school's overall reputation reflects its capacity in your field, look up that institution's own Higher Education R&D (HERD) survey data through NSF's public reporting (NSF NCSES).
What's known about international scientists leaving the United States
None of the national spending or intensity data above say anything about visa denials, departure rates, or where international researchers are choosing to go instead. That data gap matters, because public conversation about America's academic brain drain sometimes treats an emerging concern as an already-documented pattern, when the evidence reviewed for this article is something narrower: an informed warning, not a measured trend.
A 2025 commentary from a Princeton Graduate School administrator argues that international doctoral students, who play a central role in U.S. research and innovation, now face growing instability tied to restrictive immigration policy, funding uncertainty, and an unwelcoming climate, and that this instability is pushing some international scientists to consider careers abroad (Majumdar, International Higher Education, published 8 months ago). Worth flagging: that characterization of funding uncertainty describes conditions as the commentator perceives them among specific grants, agencies, or fields, not the aggregate national figures cited earlier in this article, which show academic R&D spending rising through the FY 2023 data. The two claims aren't necessarily in conflict, a total can grow nationally while individual researchers experience real uncertainty around a particular grant or agency, but the commentary doesn't distinguish between the two, so read the funding-decline claim as describing the climate researchers report feeling rather than a challenge to the topline NCSES numbers.
The same piece notes that competing countries are responding with targeted recruitment campaigns and funding incentives aimed specifically at scientific talent, and warns that without policy reform, the United States risks ceding its long-held edge in science and technology to global competitors (Majumdar, International Higher Education, published 8 months ago).
That's a credible, specific warning from someone who works directly with international doctoral students. It's also qualitative and forward-looking. It doesn't establish that departures are already happening at scale, and it shouldn't be cited as proof of a measured brain drain, since the sources reviewed for this article don't include enrollment counts, visa-denial rates, or destination-country data that would turn the warning into a documented trend.
If you're on a student or work visa, or weighing whether to come to the United States on one, don't build a decision around general commentary about the immigration climate. Confirm current visa-sponsorship and work-authorization rules directly with your university's international student and scholar office, since those rules can shift and vary by visa category.
Before you commit: questions no national statistic can answer

None of the figures above, whether national intensity, institutional HERD totals, or field-level spending shares, tell you whether a specific lab, department, or adviser can actually fund you for the length of your degree. That depends on program-level and adviser-level details these statistics don't capture at all. Before accepting an offer, get written answers to the following, and note who can actually confirm each one:
- Years of guaranteed funding, and the source. Ask for this in your written offer letter, not a verbal promise. Department fellowships, training grants, adviser grants, and teaching assistantships carry different levels of security, and the graduate program coordinator, not the prospective adviser, is usually the person who can confirm the department's backup funding policy if a grant ends early.
- Whether the funding structure depends on one grant or spreads across several sources. A single adviser's grant timeline can be hard for an applicant to get directly, so ask the graduate coordinator instead whether the department guarantees funding independent of any one grant's expiration.
- The lab's recent size, turnover, and placement outcomes. Some departments publish placement data for recent graduates and postdocs; where they don't, ask current students in the lab directly, since they're often more candid than admissions materials.
- Whether tuition remission and health coverage are included or are separate costs you'd absorb. Check the written funding offer and the graduate school's official cost-of-attendance page, not general program marketing.
- Visa sponsorship and work-authorization terms, confirmed by international student services, the graduate school, or HR for postdoc positions, specific to your visa category. General assurances from a department don't substitute for this office's confirmation.
Program staff can walk you through funding structures and sponsorship procedures. Questions about your individual immigration status, legal eligibility, or financial-aid specifics belong with your school's international office, financial aid office, or a qualified immigration attorney, not general research or commentary about national trends.
Build a short written comparison sheet with these questions answered for every program on your list. A ranking can't confirm whether a particular lab will still have money five years from now; a written funding letter and a direct answer from the graduate coordinator can.
The decision rule
The clearest fact in this data set is that U.S. academic R&D spending grew, not shrank, in the latest FY 2023 data reviewed here, its largest jump in current dollars in two decades (NSF NCSES, reported 21 months ago). The clearest sign of relative slippage is that U.S. academic R&D intensity has sat flat since 2012 while a peer like Germany kept raising its own (NSF NCSES, reported 34 months ago). The least settled claim is whether immigration policy and funding uncertainty are already driving international researchers away at scale; that remains a documented warning from one 2025 commentary, not a measured trend in the sources reviewed here (Majumdar, International Higher Education, published 8 months ago).
Funding sources, field mix, and visa-sponsorship practices vary by institution and even by department, so no single statement about U.S. university decline applies evenly across every school, and none of the national data available cover what's happened since FY 2023. Before you accept an offer or turn one down based on assumptions about where American research is headed, pull the specific program's HERD data from NSF's public reporting, get your funding-years commitment in writing from the graduate coordinator, and confirm visa-sponsorship terms directly with your university's international office.