
- College Enrollment Trends 2026: Certificates Rise, Grad Falls
- What spring 2026 college enrollment data show
- Community college enrollment growth is outpacing several other sectors
- Undergraduate and graduate enrollment are moving in different directions
- Health programs are growing while computer science enrollment falls
- What enrollment data can and cannot tell us
- How to evaluate a program before enrolling
College Enrollment Trends 2026: Certificates Rise, Grad Falls
If you are comparing college options in 2026, the national numbers point in two directions: enrollment is rising, but the rebound is concentrated and incomplete. Spring 2026 postsecondary enrollment reached 18.6 million, up 1.0% from the previous spring. Yet the increase was strongest among undergraduates at public institutions, especially community colleges, while graduate enrollment and private four-year enrollment changed little (National Student Clearinghouse Research Center reported this in June).
That pattern does not answer the most personal question, which is why a particular student enrolls. Enrollment data show where participation changed. They do not show whether students chose a program because of cost, scheduling, career goals, family expectations, or another reason. For students, parents, adult learners, and career changers, three separate questions matter: Are more people enrolling? Where are they enrolling? Does enrollment growth demonstrate value or successful completion?
The available evidence answers the first two questions more clearly than the third.
What spring 2026 college enrollment data show

The spring total included 15.5 million undergraduates, a 1.3% increase from spring 2025, and 3.1 million graduate students, a 0.1% decline. Fall 2025 showed a similar split: more than 19.4 million students enrolled overall, with undergraduate enrollment up 1.2% and graduate enrollment down 0.3% (National Student Clearinghouse Research Center reported in January).
For a high school graduate, this means the national growth is not necessarily evidence that every type of college is expanding. Public four-year colleges and community colleges are contributing more to the increase than private four-year institutions. For someone considering graduate school, the broader undergraduate recovery offers little reason to assume that master’s programs are growing at the same pace.
The spring sector figures make the difference plain:
- Community college enrollment grew 3.1%.
- Public four-year enrollment grew 1.5%.
- Private nonprofit four-year enrollment declined 0.1%.
- Private for-profit four-year enrollment declined 0.5%.
- Master’s enrollment fell 1.3% to 2.0 million.
These figures describe enrollment changes, not changes in the number of institutions. They also should not be read as a ranking of which college type is best. A student choosing between a certificate, an associate degree, and a bachelor’s degree has a different decision to make from a student comparing two master’s programs.
The fall data reinforce the same direction. Community college enrollment rose 3.0%, compared with 1.4% at public four-year colleges. Undergraduate enrollment at private nonprofit institutions fell 1.6%, while private for-profit institutions fell 2.0% (National Student Clearinghouse Research Center reported in January). The spring and fall reports therefore point to a consistent pattern, even though they measure different terms.
Community college enrollment growth is outpacing several other sectors
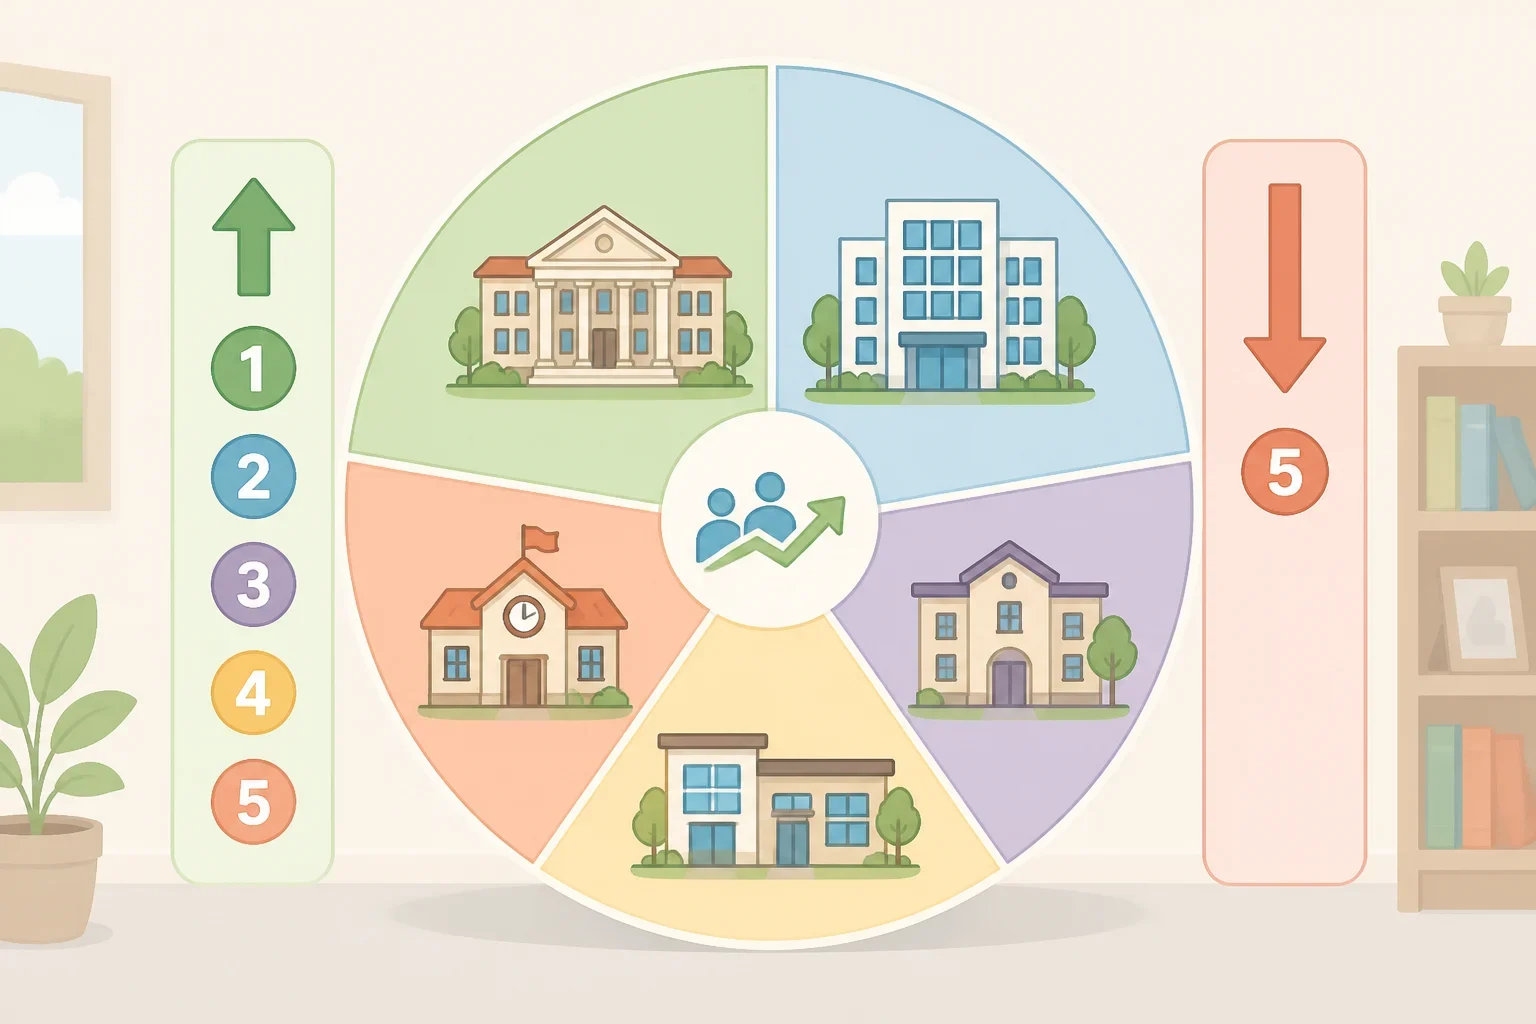
Community colleges are central to the current undergraduate increase, but the data still do not establish why individual students enrolled. Separate survey findings offer clues about what may make these institutions appealing to some learners.
Two years ago, Gallup and Lumina found that 58% of Americans had a great deal or quite a lot of confidence in two-year institutions to provide an affordable education. Only 11% expressed that level of confidence in four-year schools. The same survey found that 55% had high confidence that community colleges provide an education worth the cost, compared with 18% for four-year institutions (Gallup/Lumina reported in 2024).
Those opinions do not prove that affordability caused the 2026 enrollment increase. They do show that community colleges and four-year schools are viewed differently when people think about cost and value. That distinction can matter to a student who needs to remain close to home, work while enrolled, or begin with a smaller academic commitment.
The program mix has shifted, too. Undergraduate certificate enrollment was the fastest-growing undergraduate award category in spring 2026, increasing 10.2%. In fall 2025, community colleges had 752,000 undergraduate certificate enrollments, an increase of 28.3% from fall 2021 (National Student Clearinghouse Research Center reported in January).
A certificate may be appropriate for one learner and a poor fit for another. Its usefulness depends on the field, the credential’s recognition, the student’s goal, and whether further education will be needed. Someone seeking a specific entry-level qualification may be comparing certificates with associate degrees. Someone planning to transfer may need to focus more closely on course equivalencies and degree requirements.
The stop-out research helps explain why flexible options may appeal to some adults, without establishing that they caused sector-level growth. Among adults who had left a postsecondary pathway without earning a degree, 87% said cost was a very or moderately important reason they were not enrolled. Work conflicts affected 81%, total time to complete affected 73%, and a lack of remote learning options affected 70% (Gallup/Lumina reported two years ago).
For an adult returning to college, those responses point to practical questions. Can classes fit around work? Are required courses offered when needed? What happens if one semester has to be paused? Does the institution accept prior coursework, and will an adviser explain how it applies to the intended credential? Enrollment trends cannot answer those questions for a particular program.
Undergraduate and graduate enrollment are moving in different directions

The gap between undergraduate and graduate enrollment is one of the clearest features of the current U.S. higher education enrollment trends. Undergraduate enrollment rose in both fall 2025 and spring 2026, while graduate enrollment declined slightly in both terms (National Student Clearinghouse Research Center reported in January; National Student Clearinghouse Research Center reported in June).
Within undergraduate education, certificates and associate programs are growing faster than bachelor’s programs. In fall 2025, certificate enrollment increased 1.9% and associate enrollment increased 2.2%, compared with 0.9% growth in bachelor’s enrollment (National Student Clearinghouse Research Center reported in January). The spring report also found that undergraduate certificate programs continued to grow faster than other undergraduate award categories.
That does not mean a certificate or associate degree is automatically a better choice. It means students are entering different kinds of programs at different rates. A bachelor’s degree may be necessary for a student’s intended path, while an associate degree may serve as a transfer stage or a credential in its own right. A certificate may provide focused preparation, but its value should be checked against the requirements for the job or further program the student has in mind.
Graduate students should read the figures with similar care. Master’s enrollment declined to 2.0 million in spring 2026, and graduate international enrollment fell 4.3%, a decrease of 7,000 students. The spring international decline was driven by a 9.2% decrease at public four-year institutions (National Student Clearinghouse Research Center reported in June). The fall report recorded a separate 5.9% decline in graduate international enrollment, so these figures should not be combined as though they measured the same term.
The practical question for a graduate applicant is not whether graduate enrollment is down nationally. It is whether the specific program provides the schedule, preparation, supervision, and credential needed for the applicant’s goal. National trends can identify a direction, but they cannot substitute for program-level information.
Health programs are growing while computer science enrollment falls
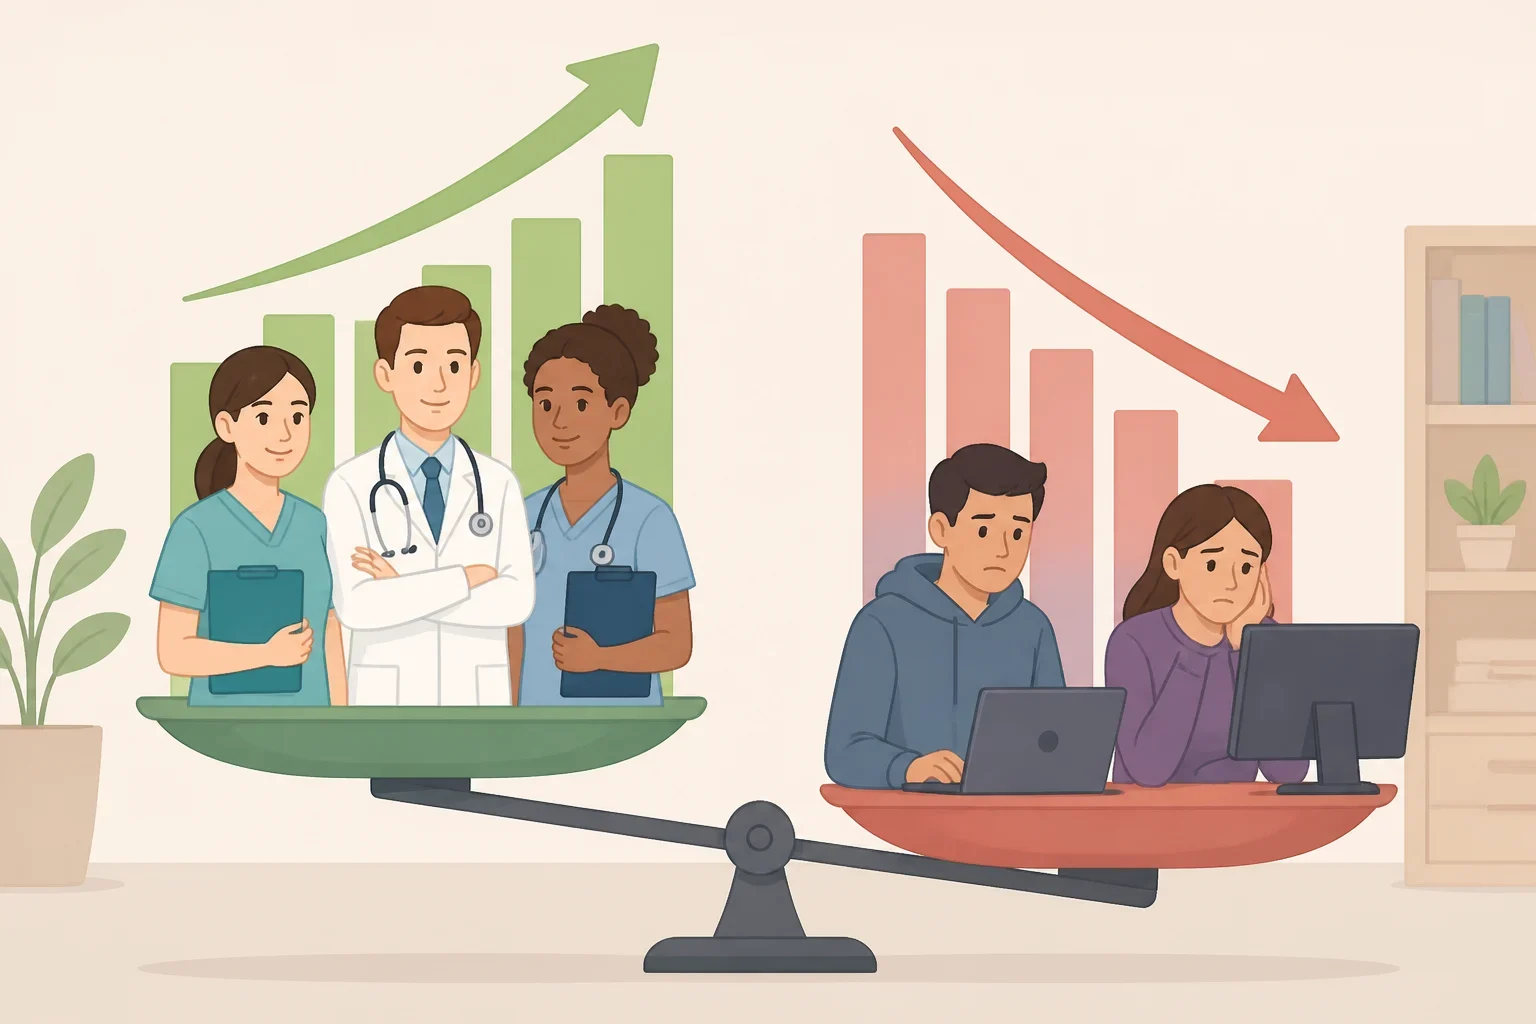
Field-level enrollment changes add another layer to the picture. Undergraduate Health Professions enrollment increased for the third consecutive year across award levels and institution types, with growth ranging from 6.0% to 7.1% in spring 2026 (National Student Clearinghouse Research Center reported in June). That range varies by award level and institution type. It does not mean that every health program grew by 7.1%.
Computer and Information Sciences moved in the opposite direction. Spring enrollment declined 8.4% at four-year institutions and 11.2% at two-year institutions. In fall 2025, declines across computer and information science categories ranged from 3.6% at undergraduate PAB institutions to 14.0% at the graduate level, depending on the award and institution category (National Student Clearinghouse Research Center and National Student Clearinghouse Research Center reported in January and June).
The data show changes in student counts, not students’ reasons. They do not establish that students view health professions as more stable, that computer science has lost its value, or that enrollment decisions reflect labor-market judgments. A student should not choose a field solely because its national enrollment is rising or avoid one solely because enrollment is falling.
Instead, use the figures as a prompt for closer questions. What courses are required? What equipment, placement experiences, or clinical requirements are involved? Does the program lead to a credential recognized in the intended field? If the program is at a two-year institution, can credits transfer as expected?
High-transfer public two-year institutions grew 5.5%, or 112,000 students, in spring 2026. These institutions account for nearly half of public two-year enrollment (National Student Clearinghouse Research Center reported in June). This pattern is consistent with increased use of community colleges as transfer pathways, but it does not prove that every student enrolling there intends to transfer.
What enrollment data can and cannot tell us
The Clearinghouse reports draw on institutions actively submitting data that represent 97% of enrollment at Title IV degree-granting institutions in the United States. That makes the reports a broad national measure of enrollment changes (National Student Clearinghouse Research Center reported in June).
Enrollment counts are useful for answering questions such as:
- Is total enrollment rising or falling?
- Are undergraduate and graduate enrollment moving together?
- Which sectors are contributing to growth?
- Are award categories changing at different rates?
- Are some fields gaining or losing students?
They cannot answer whether students complete their programs, whether a credential improves an individual’s circumstances, or whether a student’s credits will transfer smoothly. Those questions require institution- and program-level evidence.
Public confidence provides a different kind of information. In a Gallup survey conducted two years ago, 36% of Americans said they had a great deal or quite a lot of confidence in higher education, while 32% had some confidence and 32% had little or no confidence. In 2015, 57% had expressed high confidence and 10% had expressed little or none (Gallup reported two years ago). The survey also found that 31% thought higher education was headed in the right direction, compared with 68% who said it was headed in the wrong direction.
Those results measure public judgment, not enrollment behavior. Someone can distrust higher education in general and still enroll in a particular program that fits a work or learning goal. Someone else can value college but decide that the cost, schedule, or completion requirements do not work right now.
Completion data add a further caution. Among students who entered two-year institutions in 2014-15, 31% completed a degree or certificate within eight years at the institution where they started. The comparable figure for students entering four-year institutions was 54% (National Center for Education Statistics reported three years ago).
These are not completion rates for students enrolling in 2026. They describe the 2014-15 cohort and should not be used to predict an individual student’s result. They do show why enrollment alone is an incomplete measure of educational value.
The potential returning-student population is large. About 41.9 million Americans had some college experience but no degree or credential when Gallup reported the figure two years ago. Among surveyed adults who had stopped out without a degree or credential, approximately three-quarters said they had considered enrolling again within the previous two years (Gallup/Lumina reported two years ago). Interest in returning is not the same as reenrollment or completion, but it helps explain why flexible pathways remain relevant.
How to evaluate a program before enrolling
The 2026 enrollment picture can help a reader identify questions, not make the decision alone. Before comparing programs, check the following:
- Total price: Look beyond advertised tuition. Ask the institution for the full cost estimate and confirm which charges apply to the specific program.
- Time to completion: Request the normal course sequence and ask what could extend it, such as limited course availability, placement requirements, or part-time attendance.
- Program-level completion: Look for the institution’s consumer-information or outcomes page. Confirm which credential, student group, and reporting cohort the rate describes.
- Transfer rules: Ask whether intended courses apply to the next degree. Review the state higher-education agency’s transfer database or published articulation agreements when available.
- Scheduling: Check evening, weekend, online, and part-time options, but verify that required courses are offered in those formats.
- Credential purpose: Ask what the certificate or degree prepares students to do and whether additional education or another certification is commonly required.
- Direct questions: Speak with an admissions or advising office, then request the answer in writing when the information affects the program choice.
Completion rates can vary by institution, program, credential, attendance status, and reporting cohort. A national increase in enrollment cannot tell a student whether a specific program will be affordable, manageable, transferable, or suitable.
College enrollment trends 2026 show a measured recovery, not a universal rebound. Public and two-year institutions are driving much of the growth, undergraduate enrollment is outpacing graduate enrollment, and certificate programs are expanding quickly. The next decision belongs at the program level: compare the cost, schedule, completion information, transfer pathway, and credential purpose before treating national enrollment data as evidence of value.