
If you're weighing a teaching offer, a contract renewal, or whether to stick around another year in a district with shrinking enrollment, it's tempting to assume the math works in your favor. Fewer students should mean fewer classrooms to staff and more security once you're hired.
National data on teacher shortages and declining student enrollment by school district tell a messier story: enrollment has fallen nationally, while the latest national hiring survey found that most public schools reported trouble filling at least one certified teaching vacancy. One trend has not solved the other.
These figures come from different federal surveys, covering different years and different units of measurement. State-level enrollment projections run through 2031, while newer national enrollment counts are available through fall 2024.
School-level hiring data was collected in August 2024, ahead of the 2024-25 school year. Teacher mobility data compares the 2020-21 and 2021-22 school years.
None of these sources track the same district over time, so nothing here can prove that any specific district lost students and struggled to hire in the same year. What the data can do is show how these two trends coexist nationally, and point you toward the local numbers worth pulling before you make a decision based on an enrollment headline alone.
- Enrollment is dropping nationally, but not evenly, and not by grade
- Enrollment, staffing need, and teacher supply are three different numbers
- Why school district enrollment decline hasn't made teacher hiring easier
- Where shortages tend to concentrate
- What teacher turnover adds to the picture
- How to check enrollment and staffing trends for a specific district
- Put the numbers together before you decide
Enrollment is dropping nationally, but not evenly, and not by grade
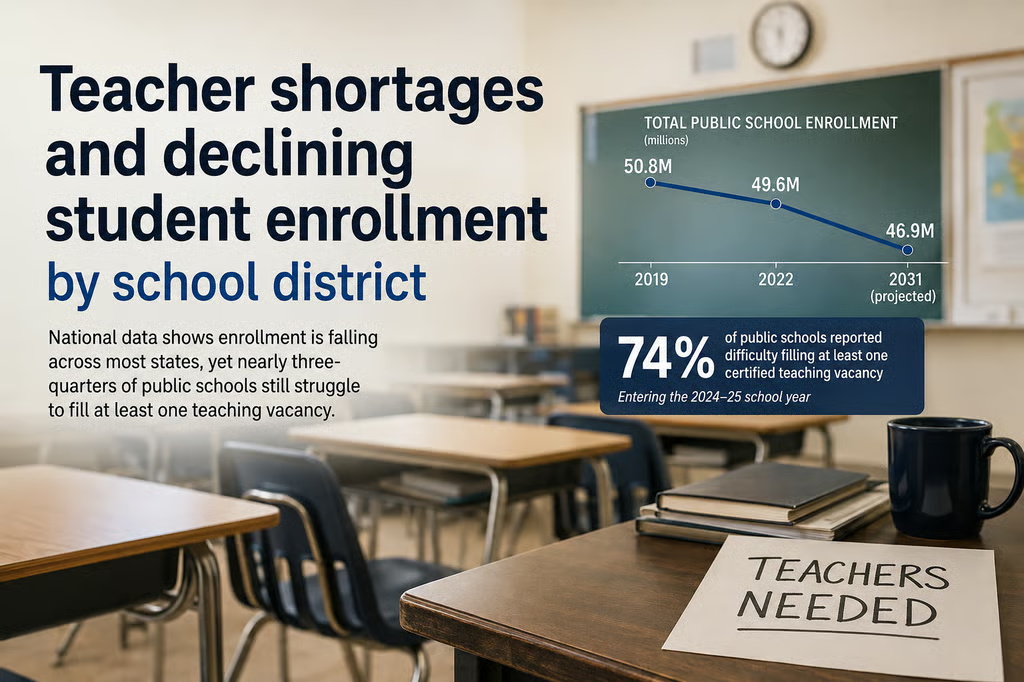
Total public school enrollment fell from 50.8 million students in fall 2019 to about 49.4 million in fall 2024, according to the latest NCES enrollment data. Separate NCES projections put enrollment at 46.9 million by fall 2031, down about 5% from the 49.6 million students enrolled in fall 2022, driven mainly by a shrinking school-age population.
That's the kind of number most likely to show up in a headline about school district enrollment decline. It's also the least useful number for judging any single district.
The projected decline is lopsided by state. Hawaii and California are each projected to lose 16% of their students between 2022 and 2031, New Mexico is projected to lose 15%, and every state in the Northeast is expected to shrink. Ten states are projected to grow instead, led by Idaho at 11% and North Dakota at 5% (NCES).
It gets more specific than state lines, too. Elementary and high school enrollment often move in opposite directions within the same state. Iowa is projected to have higher preK-8 enrollment but lower 9-12 enrollment by 2031, and 21 states saw preK-8 enrollment fall while grades 9-12 enrollment rose between 2012 and 2022 (NCES).
Separate research on school-level enrollment losses found that urban schools and middle schools were disproportionately represented among schools with the steepest post-pandemic declines, even as traditional public schools nationally had recovered roughly one-fifth of the enrollment share they lost during the pandemic by the 2022-23 school year (Brookings).
A district's total enrollment figure can hide very different realities in its elementary wing versus its high school, or in one building versus another. If you're checking a district's numbers, look at the grade band and school you'd actually teach in, not the district-wide total.
Enrollment, staffing need, and teacher supply are three different numbers
Part of why declining enrollment doesn't automatically mean easier hiring is that "fewer students" and "fewer job openings" aren't the same measurement. Three separate things are moving here, and they don't move on the same schedule.
Student demand is the enrollment count above: how many students show up. Staffing demand is how many teaching positions a district decides it needs, which depends on grade-band shifts, class-size decisions, program requirements, and certification-specific needs, not just the total headcount. Teacher supply is how many qualified, certified candidates actually apply for whatever positions come open.
A district can lose students overall and still keep staffing demand roughly flat, or even see it rise in a specific area, if the decline is concentrated in one grade band while another holds steady, the way Iowa's preK-8 and 9-12 trends diverge in opposite directions.
A district can also lose students and still need the same number of special education or bilingual education teachers, since those roles are often tied to student need and legal requirements rather than pure enrollment counts.
And even where staffing demand genuinely falls, the positions that remain still require someone qualified to fill them. If few certified candidates exist in a given subject, a smaller number of open positions can still go unfilled.
None of this proves anything about any one district; it's the mechanism that makes the national pattern in the next section plausible rather than contradictory.
Why school district enrollment decline hasn't made teacher hiring easier
Seventy-four percent of public schools reported difficulty filling at least one certified teaching vacancy entering the 2024-25 school year, based on School Pulse Panel data collected from 1,392 public K-12 schools between August 13 and August 27, 2024. That's an improvement from 79% the year before, but it still describes most schools in the survey (NCES).
As of August 2026, it remains the most recent nationally representative hiring-difficulty snapshot NCES has published. It describes conditions from two years ago, not necessarily what's happening in any district right now.
Schools averaged six teaching vacancies each and had filled 79% of them with fully certified teachers before classes started. The top two obstacles schools reported were a lack of qualified candidates (64%) and too few applicants overall (62%) (NCES). Notice what those numbers describe: a supply problem, not a demand problem. Declining enrollment can reduce how many seats a district needs to fill. It does nothing to increase how many qualified applicants exist for the seats that remain.
The strain wasn't confined to classrooms, either. Sixty-nine percent of schools reported trouble filling at least one non-teaching role heading into that same school year, and transportation staff were rated "very difficult to fill" by 90% of schools (NCES). A district losing students could still face shortages in transportation and other support roles, but this national survey doesn't identify which districts do. It's a reasonable question to ask locally, not a fact you can assume applies to any particular school.
Where shortages tend to concentrate
National data show that certain subjects, student populations, and locations report hiring difficulty more often than others. Among schools with a special education vacancy, 74% of elementary schools and 74% of middle schools reported difficulty filling it with a fully certified teacher. Among high schools with an ESL or bilingual education vacancy, 69% reported difficulty filling it (NCES).
Certified-staffing gaps also track poverty and student demographics. Schools in high-poverty neighborhoods filled only 72% of teacher vacancies with fully certified teachers, and schools where more than 75% of students were students of color filled the same 72%, both below the 83% fill rate at schools with fewer than 25% students of color (NCES).
Rural schools face their own subject-specific gaps: back in the 2020-21 school year, 57% of rural public schools with foreign-language vacancies found those positions very difficult or impossible to fill, compared with 37% in suburbs and 36% in cities (NCES). That's the most recent locale breakdown NCES has published on this measure, so treat it as a benchmark rather than this year's picture.
These patterns describe where hiring difficulty shows up most often across the country. They don't establish that subject area, poverty level, or location outweighs enrollment trend in predicting difficulty in any specific district; none of these datasets was built to make that comparison directly.
What they give you is a set of variables worth investigating locally: Is this a subject with a documented national shortage? Does this school serve a high-poverty population? Is it in a rural area with the kind of gaps described above? A shrinking district in a well-resourced suburb and a growing district in a high-poverty rural area may face very different hiring realities, but national data can't tell you which factor is driving the difference in either case. Only local numbers can.
What teacher turnover adds to the picture
Enrollment and vacancy counts tell you about the seats and the openings. Turnover tells you something different: how often the people already in those seats leave. Among public school teachers working in 2020-21, 84% stayed at the same school the following year, 8% moved to another school, and 8% left teaching altogether. Those rates were essentially unchanged from 2012-13 (NCES).
That national stability masks uneven movement underneath. Teachers with three or fewer years of experience had a 13% "mover" rate, compared to 6% among teachers with 15 or more years (NCES). A March 2026 analysis from the Learning Policy Institute, drawing on the same federal data, found turnover also ran higher among teachers who were not fully certified and among those working in schools serving larger concentrations of students from low-income backgrounds. If a district serves a high-poverty population, it's worth asking how retention looks specifically for early-career teachers there, rather than assuming the district-wide average tells the whole story.
Most of this movement stays inside the public system. Eighty-one percent of public school teacher moves were voluntary, 96% of movers went to another public school, and 51% stayed within the same district (NCES). Among public school teachers who voluntarily changed schools, 31% cited school-level factors like leadership and culture as their main reason, 27% cited personal-life factors, 11% cited assignment or classroom factors, and 9% cited salary or benefits (NCES).
The Learning Policy Institute analysis also linked lower turnover to higher pay, stronger job satisfaction and morale, and more positive perceptions of school leadership, though the researchers describe these as associated factors rather than a proven fix.
This turnover picture matters partly because the underlying national data are old. The 2021-22 Teacher Follow-up Survey was the first national teacher mobility release since 2012-13. NCES has since conducted a 2024-25 Teacher Follow-up Survey following teachers who participated in the 2023-24 National Teacher and Principal Survey, but newer attrition and mobility results have not yet been published. Until they are, the 2021-22 figures remain the latest national TFS benchmark.
How to check enrollment and staffing trends for a specific district
National and state data can tell you what's common. They can't tell you what's happening inside one specific building. Closing that gap takes some legwork, but it follows a fairly predictable order.
- Start with your state's public data, where it exists. Some, though not all, state education agencies publish district and school report cards with multi-year enrollment by grade band. What's included and how far back it goes varies widely by state, so check your state department of education's website directly rather than relying only on a district's own recruitment materials.
- Separate the district-level trend from the school-level trend. A district total can rise even while the specific school and grade band you'd teach in is shrinking, or the reverse. Ask for enrollment broken out by school and grade band, not just the district-wide figure.
- Ask the hiring administrator or HR office directly. Certification-area vacancies, emergency-credential hires, and school-level turnover often aren't captured in the same public reports as enrollment. Useful questions include:
- Which certification areas had unfilled positions on the first day of this school year?
- How many current positions are filled by teachers not fully certified in that subject?
- How many vacancies last year were covered by long-term substitutes or emergency credentials?
- What does turnover look like for this specific school, not just the district average?
- Have a backup plan if HR can't answer everything. Some of this information may not be tracked at the school level, or the person you're speaking with may not have authorization to share it. Board meeting minutes, staffing or budget reports presented at board meetings, a union collective bargaining agreement, or your state's public-records request process are reasonable next places to try, though what's available and how accessible it is depends heavily on the district and state.
- Cross-check what you're told. Compare the district's own figures against the state report card and, for national or state context, NCES enrollment data. For local specifics, your state's own district and school reporting system is a better source than a national database. No single document is likely to capture the full picture on its own.
Read what you find as a signal, not a verdict. Declining enrollment in your grade band combined with recent consolidations or reduced positions suggests more staffing risk than declining enrollment alone would. Open positions in your certification area combined with a pattern of long-term substitutes or emergency-credentialed hires suggests real demand, but it's also worth asking why those positions keep going unfilled before assuming the job is simply secure.
Stable or growing enrollment combined with high turnover at the school level, rather than the district level, points toward questions about leadership, workload, or support rather than a staffing shortage. None of these combinations guarantees an outcome. They tell you which follow-up questions are worth asking before you sign anything.
If HR is vague about certification-area vacancies or hesitant to share school-level turnover, that isn't automatically a red flag. Some of that information genuinely isn't tracked consistently everywhere. It's still worth following up in writing so you have a record of what was and wasn't disclosed before you decide.
Put the numbers together before you decide
A national headline about enrollment decline, on its own, tells you almost nothing about whether a specific teaching position is secure. Neither does a national hiring-difficulty statistic on its own. Matched against local numbers, they tell you a lot more.
Before accepting, renewing, or leaving a position, pull enrollment data broken out by grade band for the specific school you'd work in, not just the district, and confirm whether that trend matches the certification area you teach in. Then bring the hiring office the questions from the section above about vacancies, emergency credentials, and school-level turnover, and write down what they tell you.
If their answers don't match what you find in state or district report cards, or if the district can't speak clearly to its own staffing history, raise that discrepancy directly with the hiring administrator before you commit to anything.