
AI Chip Boom Reshapes Asia Air Cargo: What Data Shows
Can one airline's quarterly earnings report prove that artificial intelligence has replaced e-commerce as the force driving an entire region's air cargo business? That is the specific question worth testing before repeating a headline like the one freight forwarder Dimerco Express Group put out this week: Taiwan's Taipei air cargo hub filled to capacity, with AI chips and semiconductor equipment squeezing out space on U.S.-bound and intra-Asian routes (The Hindu BusinessLine reported). Coverage like this frames a clean storyline: the AI chip boom reshapes Asia air cargo, hub by hub, and squeezes out the parcels that used to fill those planes.
Some of the numbers behind that story are striking. IATA calculates that goods it classifies as AI-related made up 53.5% of the total value of everything carried by air worldwide in 2025, even though that category accounted for only 7% of cargo volume (IATA reported earlier this year). Korean Air's cargo revenue rose 46% in the second quarter of 2026, to $1.07 billion, and the airline says AI chips, server racks, and data-centre hardware overtook China-origin e-commerce as its primary growth engine (The Hindu BusinessLine reported).
At the same time, China's low-value and e-commerce exports fell 7% in May, the sixth straight monthly decline. That slide followed the United States' 2025 decision to end duty-free treatment for low-value Chinese imports, and it came before the European Union eliminated its own duty-free threshold this month (The Hindu BusinessLine reported). Those are three separate, sequential policy events, not one simultaneous shock, and collapsing them into a single cause muddies the analysis.
This article tests one specific claim: that AI hardware is replacing e-commerce as the growth engine of Asian air cargo. That claim holds up clearly at the level of individual carriers like Korean Air. It does not yet hold up as an industry-wide replacement, since IATA's own 2026 outlook still lists e-commerce as a structural driver of global air cargo growth. For students researching global trade, journalism students covering supply chains, or anyone building an argument from business reporting, the useful skill here is not memorizing the numbers. It is learning to check what each number actually measures before citing it as proof of a trend.
AI chips and semiconductor air freight strain Asia's hubs
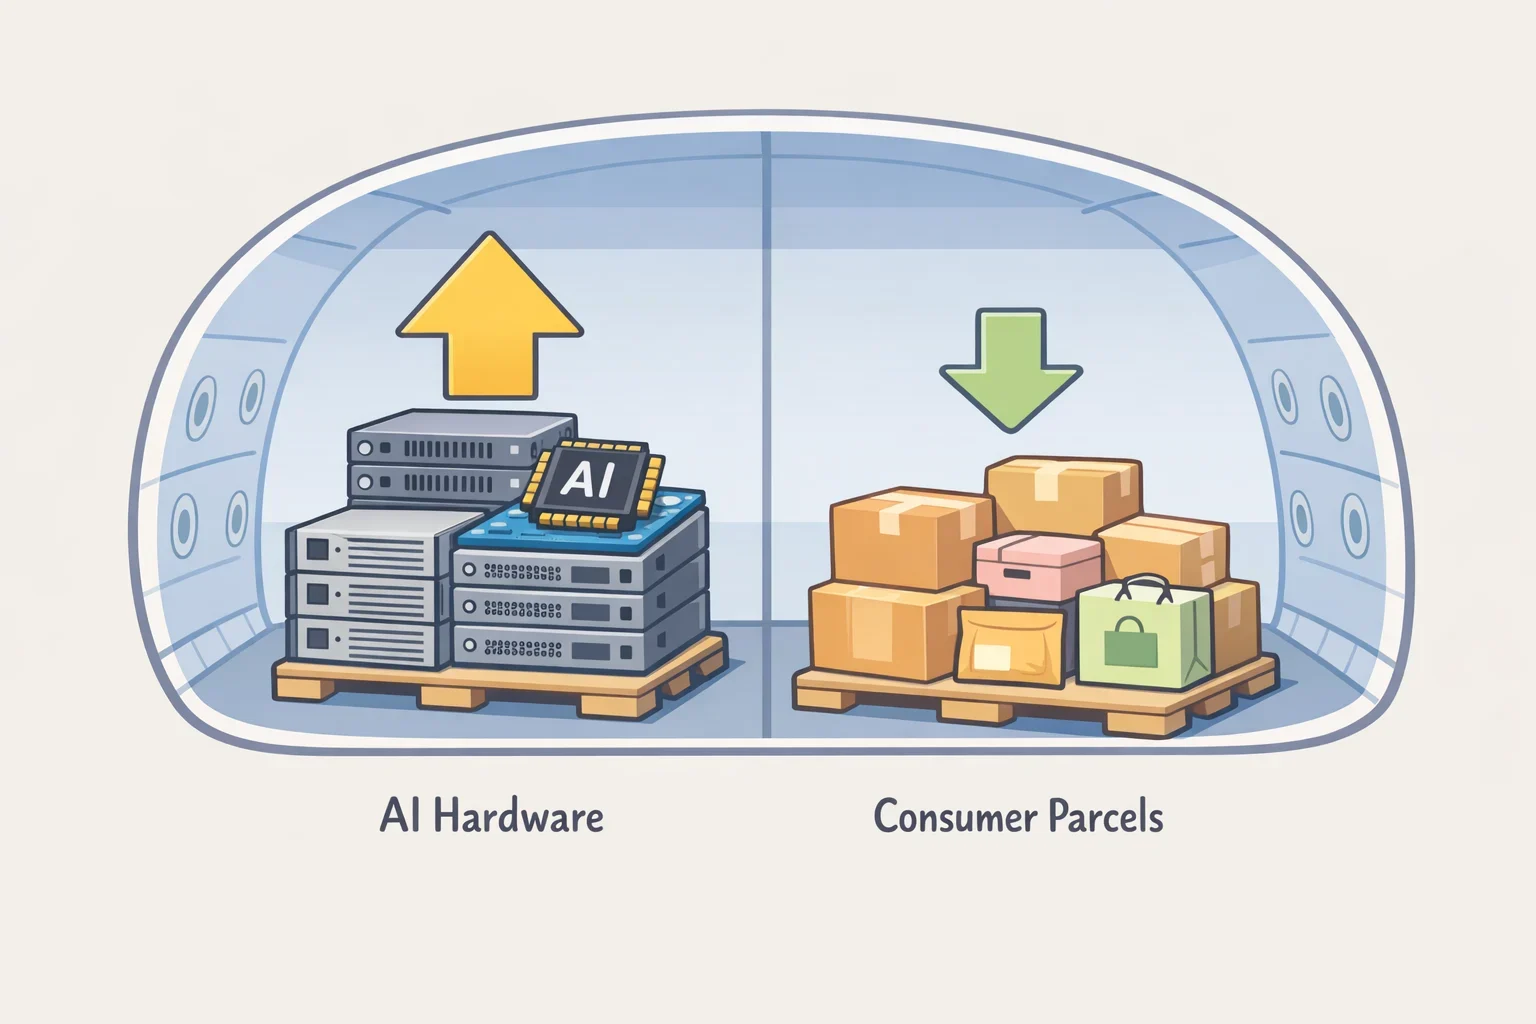
Start with why this cargo gets outsized attention even though it is a small share of total shipments. AI-related goods generated 20% year-on-year growth in air-cargo consignments in 2025, nearly six times the industry's overall 3.4% demand growth for the year (IATA reported earlier this year; IATA reported at the start of the year). Global semiconductor sales more than doubled year-on-year in April, the strongest growth since industry records began in 1986, which helps explain why chip-linked freight has become a priority for carriers even at low volume (The Hindu BusinessLine reported).
Value density is the mechanism worth understanding. A pallet of server racks or advanced memory chips is worth vastly more per kilogram than a pallet of consumer parcels, so it can generate outsized revenue and outsized attention while moving through the same cargo hold as everything else. That is a plausible explanation for why a category representing only 7% of volume can represent more than half of global air-cargo value, though it does not by itself prove that this cargo has displaced other freight rather than simply adding to it.
Airlines are also changing how they handle this freight, which shows up in operational decisions rather than industry-wide standards. Cathay Pacific Airways said it introduced software to calculate how sensitive semiconductor equipment and AI hardware should be loaded and secured inside aircraft, an operational response to the specific handling needs of this cargo rather than evidence that every carrier now works under new sector-wide rules (The Hindu BusinessLine reported).
The pressure is visible at specific hubs. Singapore Changi's cargo throughput grew 8.7% year-on-year in the first half of 2026, which airport officials attributed to global semiconductor demand, and Dimerco separately reported that Taipei's hub filled to capacity in July with tight freight space on routes to the U.S. and within Asia (The Hindu BusinessLine reported). These reports show pressure building at two named hubs. They do not by themselves show whether that pressure is spreading network-wide or staying concentrated at chip-manufacturing centers like Taiwan, South Korea, and Japan.
The e-commerce slowdown in Asian air freight, in sequence
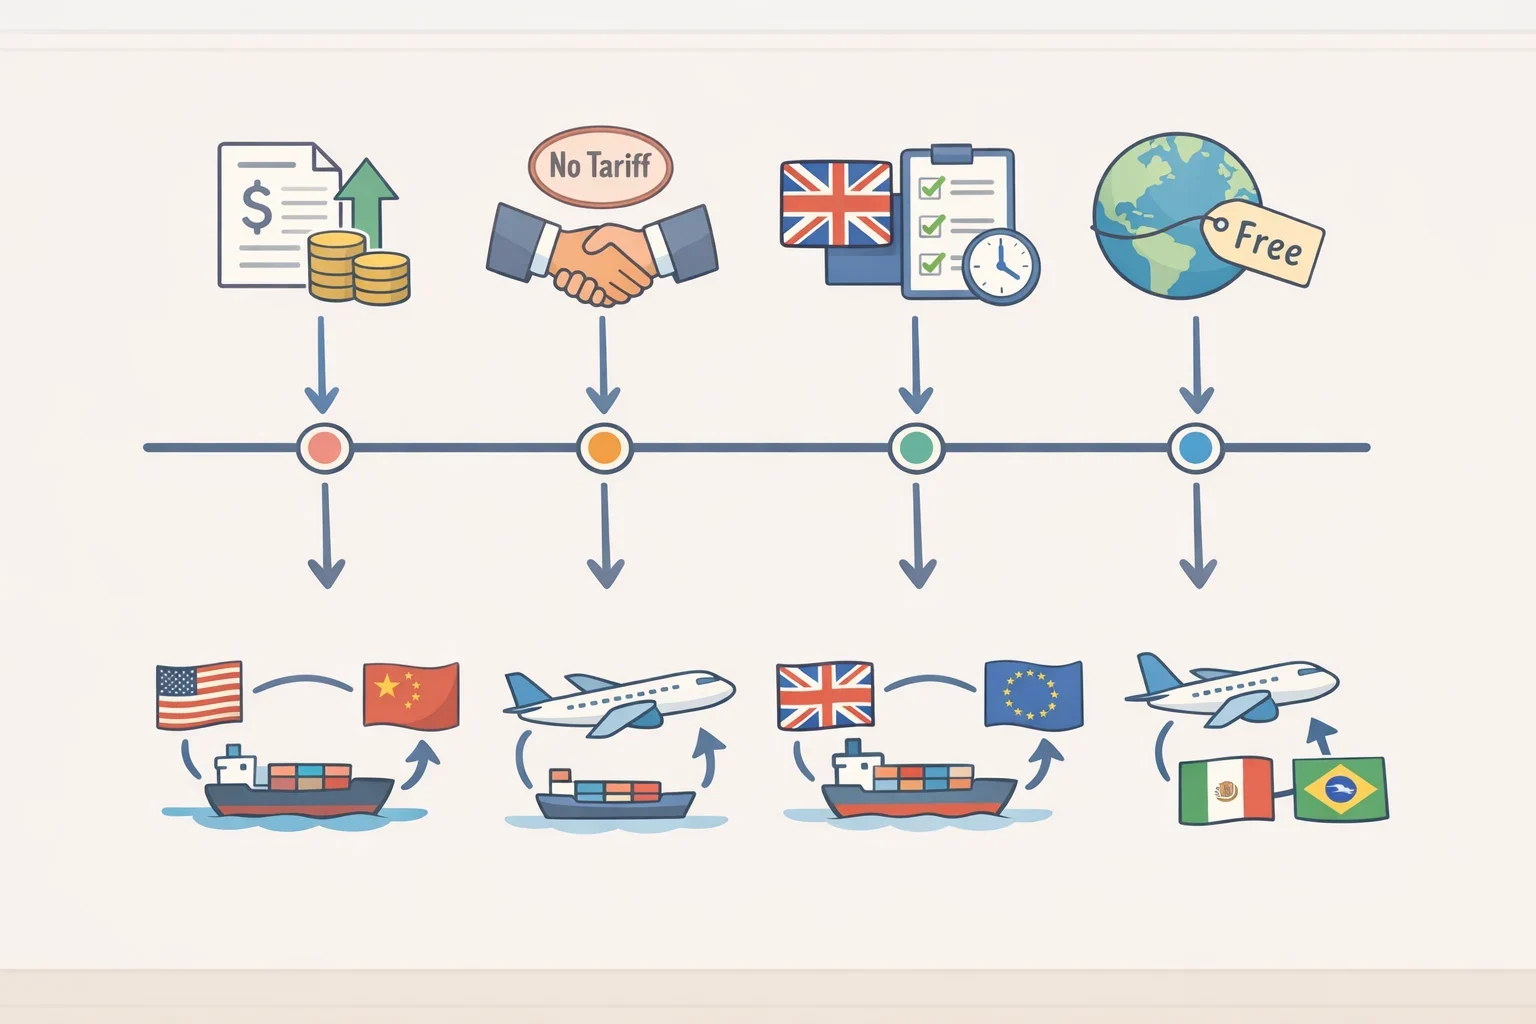
The e-commerce slowdown in Asian air freight did not happen at the same time as, or necessarily because of, the AI cargo surge. Untangling the order of events matters for anyone trying to cite this trend accurately.
Parcel demand changed first. China's low-value and e-commerce exports fell 7% in May, the sixth consecutive monthly decline, a trend that took hold after the U.S. removed duty-free treatment for low-value Chinese imports in 2025, months before the EU eliminated its own threshold this month (The Hindu BusinessLine reported).
Trade lanes then shifted, largely because of tariffs rather than AI demand. Average U.S. tariff rates rose to about 17% in 2025, their highest level since the 1930s, and companies raced to move goods ahead of new duties. Air cargo carried $157 billion of frontloaded U.S. imports in the first quarter of 2025 alone (IATA reported earlier this year). IATA's own trade lane data attributes the resulting move from Asia-North America toward Asia-Europe primarily to tariff pressure and the end of the U.S. de minimis exemption, not to AI-related demand (IATA reported late last year).
Technology cargo then reinforced that shift on specific routes, without necessarily creating it. Japan Airlines said technology products accounted for roughly 80% of the increase in Asian air exports excluding China over the prior year. China Airlines said AI-related demand helped lift its cargo volumes 8.1% in the first half of 2026 as it added Southeast Asian freighter flights, and EVA Airways said AI-linked shipments now account for up to half of its cargo revenue (The Hindu BusinessLine reported). Notice that EVA's figure describes a share of revenue, not a claim that AI cargo replaced e-commerce as its leading growth driver; the two statements sound similar but say different things.
Taken together, this sequence is consistent with AI hardware amplifying an already tariff-driven lane shift, rather than single-handedly causing it. The data cannot separate how much of the Asia-Europe growth comes from chips specifically versus other goods rerouted for tariff reasons, so treat that connection as a plausible reinforcement, not a proven cause.
Reading high-tech cargo demand in Asia like a researcher
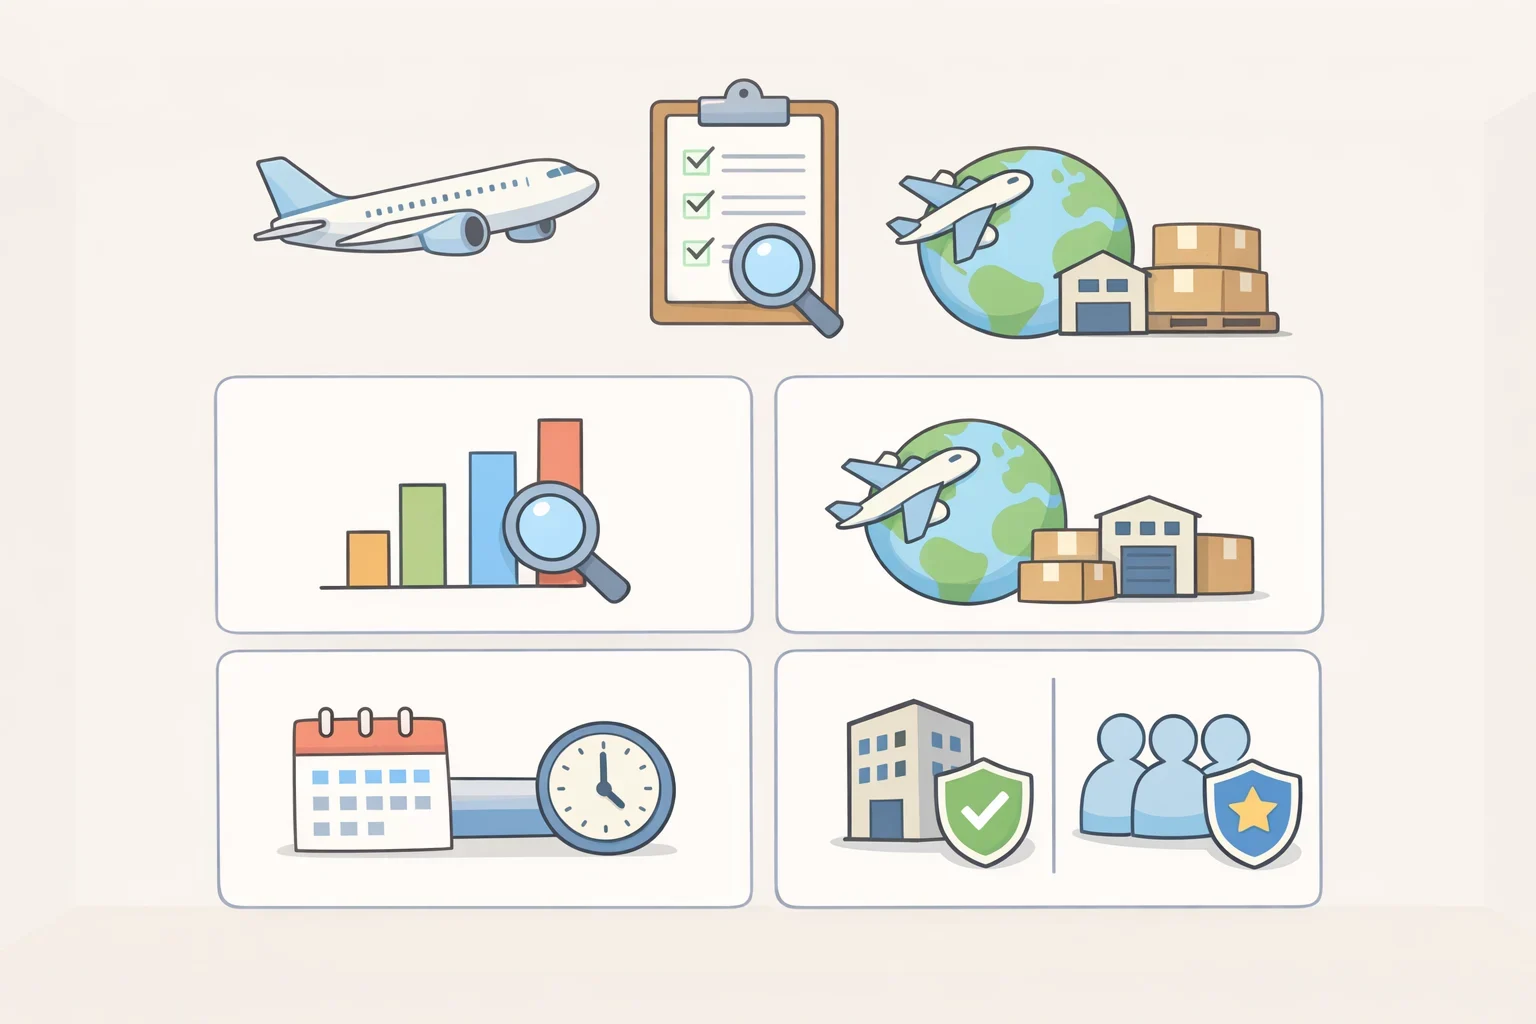
Evaluating high-tech cargo demand in Asia responsibly means checking five things before citing any statistic from this trend: what metric it measures, what geography it covers, what time period it spans, what type of source produced it, and whether it reflects a company's own explanation or an independently verified cause.
A few terms matter here. Cargo tonne-kilometers, or CTK, measure demand by combining weight carried and distance flown, which is different from cargo value in dollars and different again from raw tonnage. Capacity, measured as available cargo tonne-kilometers, describes how much space airlines have deployed, while load factor describes how full that space actually is. Company attribution means a business is explaining its own results in its own words; independent data means a third party, like IATA, measured the same trend across many companies. Both can be true and useful, but they carry different weight as evidence.
A short comparison shows why blending these figures produces a misleading picture:
Statistic Source What it measures Scope and period Type of claim 53.5% of global air-cargo value IATA Trade value share Worldwide, AI-related goods, 2025 Independent industry data 8.7% cargo throughput growth Changi Airport Group Airport throughput One airport, first half of 2026 Official airport statement 46% cargo revenue growth Korean Air Quarterly revenue One airline, second quarter 2026 Company attribution 8.1% cargo volume growth China Airlines Airline volume One airline, first half of 2026 Company attribution
None of these rows can be added together or used to stand in for the others, because each measures something different at a different scale over a different stretch of time (IATA reported earlier this year; The Hindu BusinessLine reported).
Korean Air's statement that high-tech cargo replaced e-commerce as its primary growth engine is the airline explaining its own results, not an outside audit of the industry. That distinction does not make the claim false, but it does make it a company attribution rather than an independently verified cause, and it is the clearest case of that kind in the sources reviewed here (The Hindu BusinessLine reported).
Zoom out to the industry level and the picture gets more cautious. Asia-Pacific carriers recorded 8.4% overall demand growth in 2025, the strongest of any region (IATA reported at the start of the year). But IATA's own outlook, released late last year, still credits e-commerce alongside AI-driven investment as a structural driver behind its projected 2.6% global cargo growth for 2026 (IATA reported late last year). IATA has not itself declared e-commerce replaced as an industry-wide growth engine, which is a meaningful gap between what individual airlines are reporting and what the trade body tracking all of them is willing to say.
What to do with these numbers next

The clearest documented case of "AI replacing e-commerce" sits at the level of a single airline, Korean Air, with several other carriers reporting AI-linked cargo as a major contributor using different metrics that should not be averaged into one industry figure. The broader, industry-wide version of that claim is still developing, not settled, since IATA's own reporting keeps e-commerce on the list of structural growth drivers even as tariff policy visibly reduces China-origin parcel exports.
For a research paper, an economics assignment, or a classroom discussion on global trade, the practical move is to build a simple comparison table before citing any statistic from this story, with columns for source, metric, geography, time period, and whether the claim is a company attribution or independent data. Populate it with the figures above, then decide what each one actually supports rather than what headline it appeared under.
Before submitting that work, check the assignment's citation requirements with the instructor and confirm whether primary sources like IATA reports are expected over secondary news coverage. If the assignment allows updates closer to the deadline, check IATA's next monthly Air Cargo Market Analysis release against the same table columns, since that report is where an industry-wide replacement claim, if it eventually holds, would first show up in independent data rather than in a single company's earnings call.